How to read the walkthroughs
Every module follows the same path: the problem is restated in plain language, the roadmap previews the destination, and the detailed steps make the chain clue → principle → operation → result → sanity check explicit. The source markers identify the permitted course evidence for each claim. The external photographs on the published page are context only; the original course diagrams and cited course sources carry the teaching content.
Contents
- Glycolysis and alcoholic fermentation
- Assigned lipids
- Q1: DNA microarray
- Q2: Microcalorimetry
- Q3a: Enzyme-kinetics graph
- Q3b: Absorbance slope
- Q3c: LDH activity in IU
- Q3d: pH change
- Q3e: Limiting pH change
- Q3f: Tris preparation
- Q3g: Phosphate preparation
- Q3h: Why buffers matter
- Q3i: LDH gels
1. Glycolysis and alcoholic fermentation

Problem
HW1 identifier and page: Opening glycolysis/alcoholic-fermentation directive, pages 1 and 3. [HW1 pp.1, 3]
Plain-language restatement: Reconstruct the full course pathway from glucose through pyruvate and then through alcoholic fermentation. Show metabolite structures, enzyme names, carrier/cofactor requirements, reversible versus irreversible reactions, and the stated regulatory controls. [HW1 pp.1, 3]
Given: The course pathway uses the lecturer's DAP, G3P, and G3PDH naming; the six-carbon pathway splits into two three-carbon streams, and the terminal fermentation reactions regenerate NAD⁺. [N-S3 §§21–29] [N-S4 §§1–13]
Find: A complete, correctly annotated pathway and a carbon/ATP/NAD audit. [HW1 p.1]
Required answer form: A labeled drawing plus a short bookkeeping conclusion; every post-split event must be counted twice per glucose. [HW1 pp.1, 3] [N-S4 §2]
Solution roadmap
- Build the carbon skeleton from one C6 glucose to two C3 products. 2. Add all course metabolite structures and enzymes. 3. Add ATP, NAD, Pᵢ, H₂O, Mg²⁺, and TPP where stated. 4. Apply the ×2 rule after TPI. 5. Finish alcoholic fermentation and NAD⁺ regeneration. 6. Mark reversibility/regulation. 7. Audit the final result: 6 carbons remain, net ATP is 2, and 2 NAD⁺ are regenerated per glucose. [N-S3 §§21–29] [N-S4 §§1–14]
Detailed A–Z walkthrough
Step 1 — Build the carbon skeleton
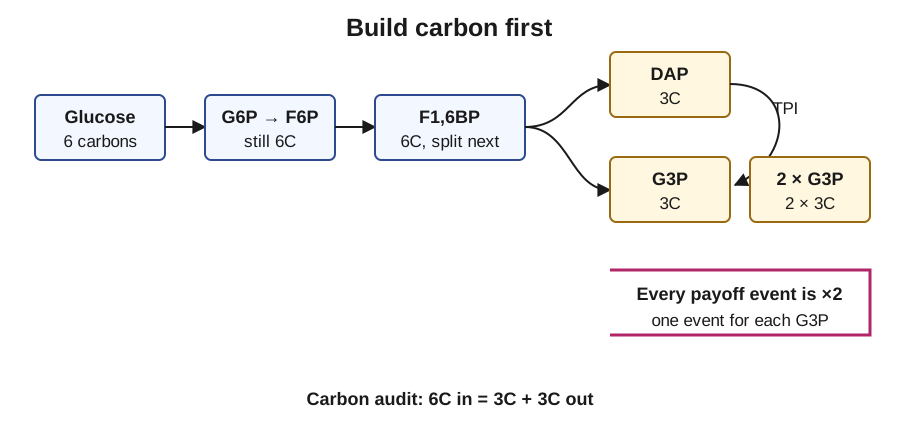
What we know: Glycolysis begins with one six-carbon glucose and aldolase later divides fructose-1,6-bisphosphate between C3 and C4 into two three-carbon products. [N-S3 §§21, 28–29]
Knowledge needed: Track carbon count before names or energy carriers; carbon cannot disappear from the pathway drawing. [N-S3 §§21, 28–29]
Reasoning—why this step: Establishing the one-C6-to-two-C3 geometry first prevents the most common downstream error: forgetting that all payoff reactions occur twice. [N-S4 §2]
Work: Draw glucose (6C) → G6P (6C) → F6P (6C) → F1,6BP (6C) → DAP (3C) + G3P (3C). Then draw DAP ⇌ G3P, leaving two G3P molecules to enter the payoff phase. [N-S3 §§21–29] [N-S4 §§1–2]
Checkpoint: The drawing now contains one six-carbon investment stream and two three-carbon payoff streams; total carbon is still six. [N-S4 §2]
Step 2 — Add course metabolite structures and enzyme names
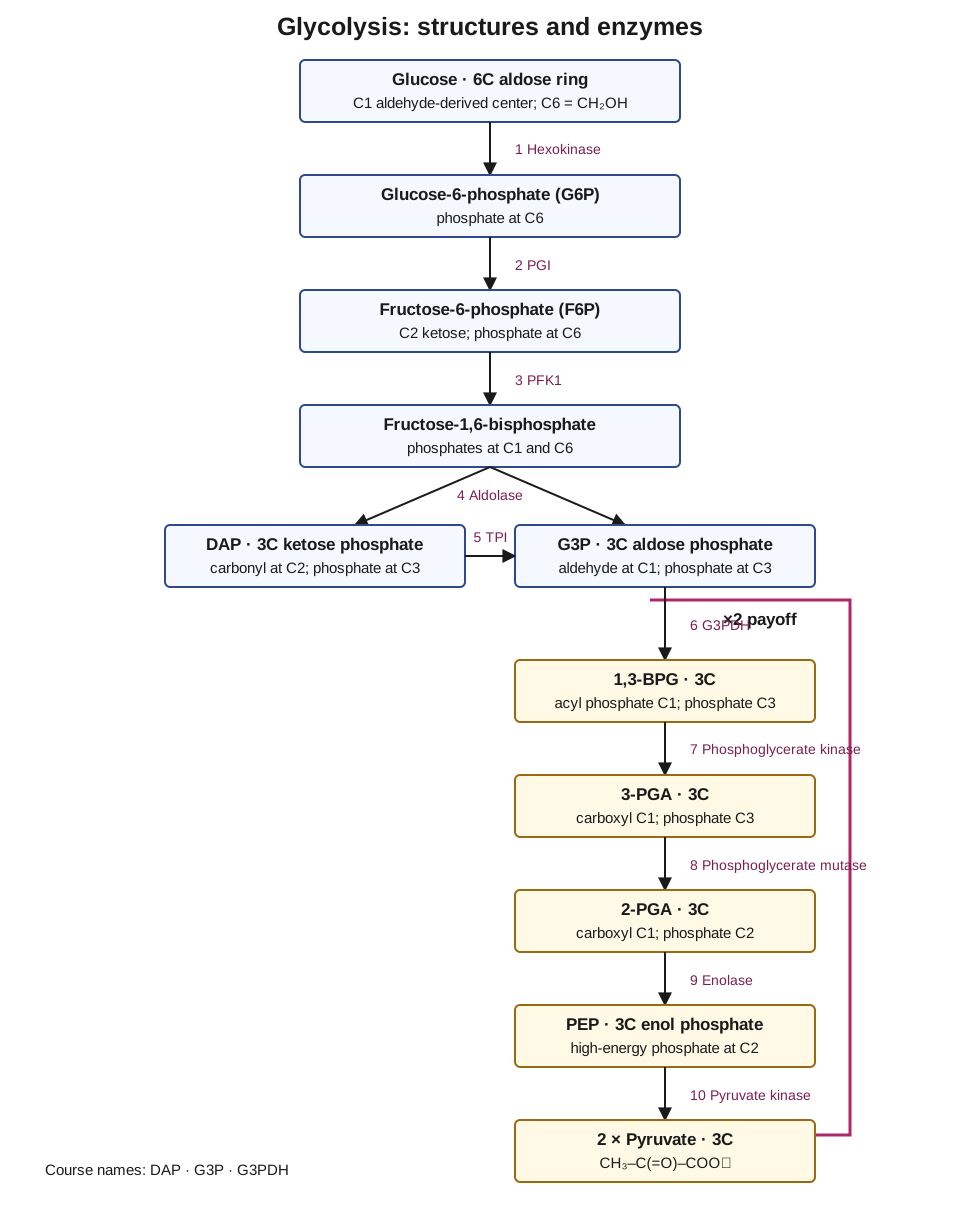
What we know: The ordered enzyme sequence is hexokinase, PGI, PFK1, aldolase, TPI, G3PDH, phosphoglycerate kinase, phosphoglycerate mutase, enolase, and pyruvate kinase. [N-S3 §§22–29] [N-S4 §§1–8]
Knowledge needed: Phosphate placement distinguishes G6P/F6P/F1,6BP and 1,3-BPG/3-PGA/2-PGA/PEP; the lecturer uses DAP rather than DHAP. [HW1 p.3] [N-S3 §§24–29] [N-S4 §§1–8]
Reasoning—why this step: Names alone do not satisfy a structure question; each arrow must connect the correct carbonyl and phosphate arrangement to the enzyme that performs the change. [HW1 pp.1, 3]
Work: Extend each G3P through 1,3-BPG → 3-PGA → 2-PGA → PEP → pyruvate. Write the corresponding enzyme over every arrow and sketch the course condensed structure under every metabolite name. [N-S4 §§3–8]
Checkpoint: Ten glycolytic arrows now connect eleven named states from glucose to pyruvate, and the payoff lane is visibly doubled. [N-S3 §§21–29] [N-S4 §§1–8]
Step 3 — Add carriers, cofactors, and the ×2 arithmetic
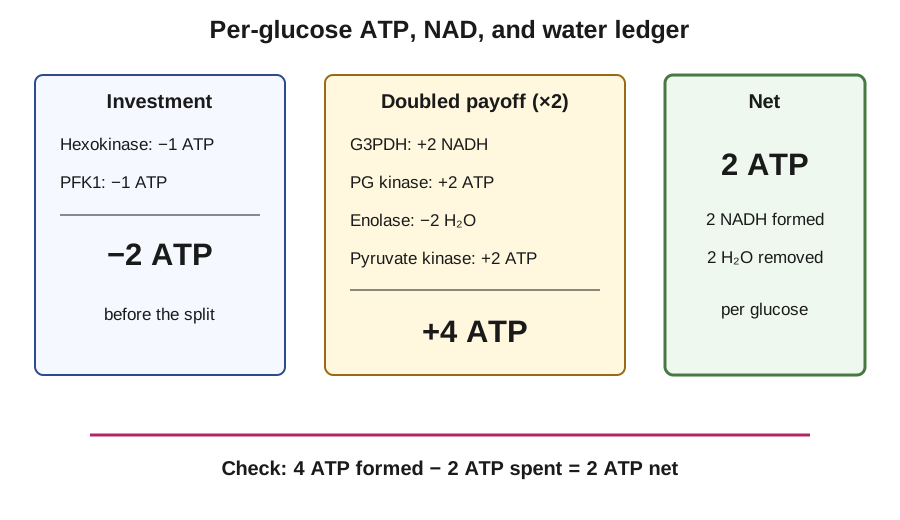
What we know: Hexokinase and PFK1 each consume one ATP before the split. G3PDH uses Pᵢ and NAD⁺ and forms NADH + H⁺; phosphoglycerate kinase and pyruvate kinase each form ATP, and those payoff reactions run twice. Enolase removes water. Mg²⁺ acts with hexokinase, and the official pathway also places Mg²⁺ at the phosphoglycerate-kinase ATP-transfer step. [HW1 p.3] [D6 p.2] [N-S3 §§24–25, 27] [N-S4 §§3–8]
Knowledge needed: A carrier event written on one payoff arrow represents two events per starting glucose because two G3P molecules traverse it. [N-S4 §2]
Reasoning—why this step: Carrier bookkeeping must follow the carbon multiplier; otherwise a visually correct pathway can still give the wrong net ATP or NAD result. [N-S4 §§2–8]
Work: Put each carrier beside its own arrow: step 1 ATP → ADP; Mg²⁺, step 3 ATP → ADP, step 6 2 × (Pᵢ + NAD⁺ → NADH + H⁺), step 7 2 × (ADP → ATP; Mg²⁺), step 9 2 × H₂O removed from substrate, and step 10 2 × (ADP → ATP). Then compare the nicotinamide rings: NAD⁺ has a pyridinium N⁺ and hydride-accepting C4; addition of hydride at C4 gives neutral NADH. Both forms absorb strongly near 260 nm and differ only slightly there, whereas NADH has the useful 340-nm band and NAD⁺ is approximately zero at 340 nm. [HW1 p.3] [D6 pp.2, 4] [N-S3 §§25] [N-S4 §§12]
Checkpoint: Gross ATP formed is 4, ATP spent is 2, net ATP is 2, and glycolysis has produced 2 NADH per glucose. [N-S4 §§3–8, 14]
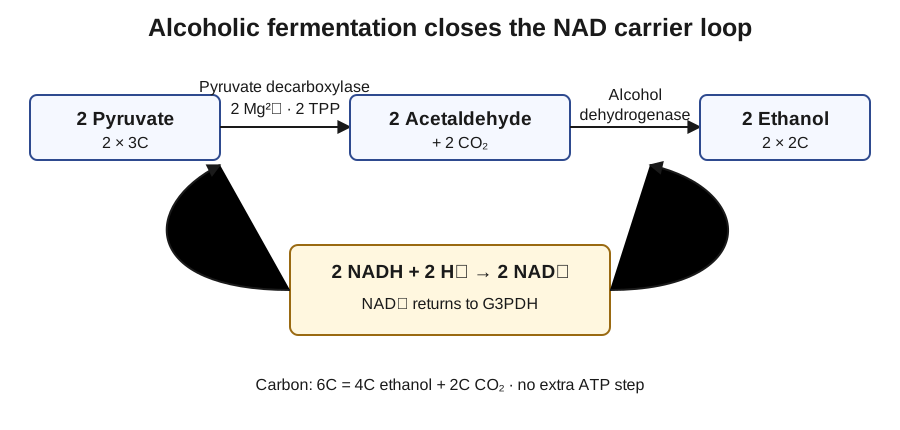
Step 4 — Complete alcoholic fermentation and regenerate NAD⁺
What we know: Glycolysis contains 10 reactions from glucose to pyruvate. Adding LDH gives the 11-reaction glucose-to-lactate route. Alcoholic fermentation instead adds pyruvate decarboxylase and alcohol dehydrogenase, giving 12 reactions from glucose to ethanol. Pyruvate decarboxylase uses Mg²⁺ and TPP; both terminal branches oxidize NADH back to NAD⁺. [HW1 p.3] [D6 p.2] [N-S4 §§9–10]
Knowledge needed: Fermentation's essential carrier function is NAD⁺ regeneration; it does not add another ATP-forming step to the course pathway. [N-S4 §§9–10, 14]
Reasoning—why this step: G3PDH requires NAD⁺. Without reoxidation of NADH, the available NAD⁺ pool would be depleted and glycolytic flux would stop at that oxidation step. [N-S4 §§3, 9–10]
Work: First show the alternative 11th reaction, 2 pyruvate + 2 NADH + 2 H⁺ ⇌ 2 lactate + 2 NAD⁺, labeled LDH. For the 12-reaction alcohol route, draw 2 pyruvate → 2 acetaldehyde + 2 CO₂ above pyruvate decarboxylase with 2 Mg²⁺, 2 TPP; then draw 2 acetaldehyde + 2 NADH + 2 H⁺ ⇌ 2 ethanol + 2 NAD⁺ above alcohol dehydrogenase. [N-S4 §§9–10]
Checkpoint: Either terminal route consumes the 2 NADH made at G3PDH and returns 2 NAD⁺. The count is 11 reactions for lactate or 12 for ethanol; the branches are alternatives, not one 13-reaction chain. [N-S4 §§3, 9–10]
Step 5 — Mark regulation and reversibility
What we know: The course identifies hexokinase, PFK1, and pyruvate kinase as one-way/allosteric glycolytic control points and pyruvate decarboxylase as the one-way/allosteric alcoholic-fermentation control point. PFK1 is activated by ADP and inhibited by ATP. [N-S4 §13]
Knowledge needed: Negative regulation slows a reaction; it does not mean the enzyme is always off. [N-S4 §13]
Reasoning—why this step: Direction arrows and regulator labels answer a different part of the directive than structures and cofactors, so they require a separate audit. [HW1 p.1]
Work: Use single forward arrows for the four course-stated one-way/allosteric reactions and reversible arrows for the other stated pathway steps. Beside PFK1 write ADP (+) and ATP (−); do not add regulators not stated in the allowed sources. [N-S4 §13]
Checkpoint: Every arrow now states both chemical direction and, where supported, regulatory status. [HW1 p.1] [N-S4 §13]
Step 6 — Perform the independent audit
What we know: One glucose contains six carbons; the branch yields two ethanol molecules and two CO₂, for 2×2C + 2×1C = 6C. The ATP ledger nets 2 and the NAD ledger closes at zero net change in the carrier pool. [N-S4 §§10, 14]
Knowledge needed: Carbon conservation, carrier recycling, and ATP arithmetic are independent checks on the same pathway. [N-S4 §§2–14]
Reasoning—why this step: Independent ledgers catch omissions that a visual arrow-by-arrow review may miss. [N-S4 §§2–14]
Work: Carbon: 6C glucose → 2(2C ethanol) + 2(1C CO₂) = 6C. ATP: 4 formed − 2 spent = 2 net. NAD: 2 NAD⁺ used at G3PDH − 2 NAD⁺ regenerated at alcohol dehydrogenase = 0 net carrier loss. [N-S4 §§3–10, 14]
Checkpoint: Carbon, ATP, and NAD accounts all balance, so the drawing is internally consistent. [N-S4 §14]
Step 7 — Use the symbolic thermodynamics pattern
What we know: Under the standard reference state, ΔG° = −RT ln K_eq. For biochemical reactions involving protons, the prime denotes the pH-7 transformed reference state, so the paired symbols are ΔG°′ and K_eq′. [N-S4 §§15]
Knowledge needed: Reversing a reaction changes the sign of its free-energy change and replaces its equilibrium constant with the reciprocal. Coupling reactions adds their free-energy changes and multiplies their equilibrium constants. [N-S4 §§16]
Reasoning—why this step: The symbols let you manipulate a course reaction without reconstructing any unavailable assigned exercise: direction controls the sign, and coupling combines complete reactions. [N-S4 §§16]
Work: Start with ΔG° = −RT ln K_eq; when the reference condition fixes protons at pH 7, write the transformed pair ΔG°′ and K_eq′. For A → B, reversal gives B → A, ΔG°′_rev = −ΔG°′_fwd, and K_eq′_rev = 1/K_eq′_fwd. If that reversed reaction is coupled to B → C, add the two ΔG°′ values and multiply the two K_eq′ values after canceling the shared intermediate B. [N-S4 §§15–16]
Checkpoint: The final symbolic reaction contains no uncanceled intermediate; its ΔG°′ is the algebraic sum and its K_eq′ is the product after any reciprocal required by reversal. [N-S4 §§16]
Final answer
The completed answer is the four-figure pathway above: glucose proceeds through the 10 named glycolytic reactions to two pyruvates. The LDH branch is reaction 11 to lactate; the alcoholic branch adds reactions 11 and 12 to make two ethanol + two CO₂. Either branch regenerates two NAD⁺. The course one-way/allosteric steps are hexokinase, PFK1, pyruvate kinase, and pyruvate decarboxylase; PFK1 has ADP activation and ATP inhibition. Net yield is 2 ATP per glucose, with no net loss of the NAD⁺/NADH carrier pool. The general thermodynamics pattern is ΔG° = −RT ln K_eq, with ΔG°′/K_eq′ at pH 7; reversal changes sign/inverts K, and coupling adds ΔG values/multiplies K values. [N-S4 §§9–16]
Why the answer makes sense
Three unrelated checks agree: six carbons enter and six leave; the two investment ATP are smaller than the four payoff ATP; and every NAD⁺ reduced during glycolysis is regenerated during alcoholic fermentation. A missing ×2, CO₂, or NAD⁺-regeneration arrow would fail at least one of these checks. [N-S4 §§2–14]
Common mistakes
- Forgetting the post-TPI ×2 multiplier produces 1 NADH and only 0 net ATP instead of the per-glucose result. [N-S4 §§2–8]
- Writing alternative textbook abbreviations in place of course DAP/G3P/G3PDH can obscure alignment with the assigned pathway. [N-S4 §§1–3]
- Adding unsupported regulators fails the narrow source contract; use only the course-stated controls. [N-S4 §13]
- Drawing ethanol formation without NAD⁺ regeneration misses the biochemical purpose of the terminal branch. [N-S4 §§3, 10]
- Counting the lactate and ethanol branches in one chain is incorrect: they are alternative 11- and 12-reaction routes from glucose. [N-S4 §§9–10]
- The symbolic thermodynamics pattern above is course-supported scaffolding, not a reconstruction of the unavailable assigned Segel exercises. [HW1 p.1] [N-S4 §§15–16]
2. Assigned lipids
Problem
HW1 identifier and page: Opening lipid directive, page 1. [HW1 p.1]
Plain-language restatement: Be able to draw a triacylglycerol, phosphatidylcholine, and phosphatidylserine using any of five assigned fatty acids, with the correct carbon numbering, cis double-bond positions, glycerol attachments, and headgroups. [HW1 p.1]
Given: The assigned acids are 16:0 palmitic, 18:0 stearic, 18:1(9) oleic, 18:2(9,12) linoleic, and 18:3(9,12,15) α-linolenic. [HW1 p.1]
Find: Correct fatty-acid sketches and the three complete lipid classes. [HW1 p.1]
Required answer form: Structural drawings with carboxyl-carbon and glycerol numbering, cis double bonds, ester/phosphodiester bonds, and charges on the headgroup where shown in the course. [N-S2 §§6–8]
Solution roadmap
Decode each fatty-acid code, number from carboxyl C1, place every cis double bond, number glycerol 1–3, form the required ester bonds, put the correct group on glycerol C3, then audit bond count, positions, and headgroup charge. A triacylglycerol has three acyl chains; each phospholipid has two acyl chains plus a C3 phosphate linked to choline or serine. [HW1 p.1] [N-S2 §§6–8]
Detailed A–Z walkthrough
Step 1 — Decode the fatty-acid notation
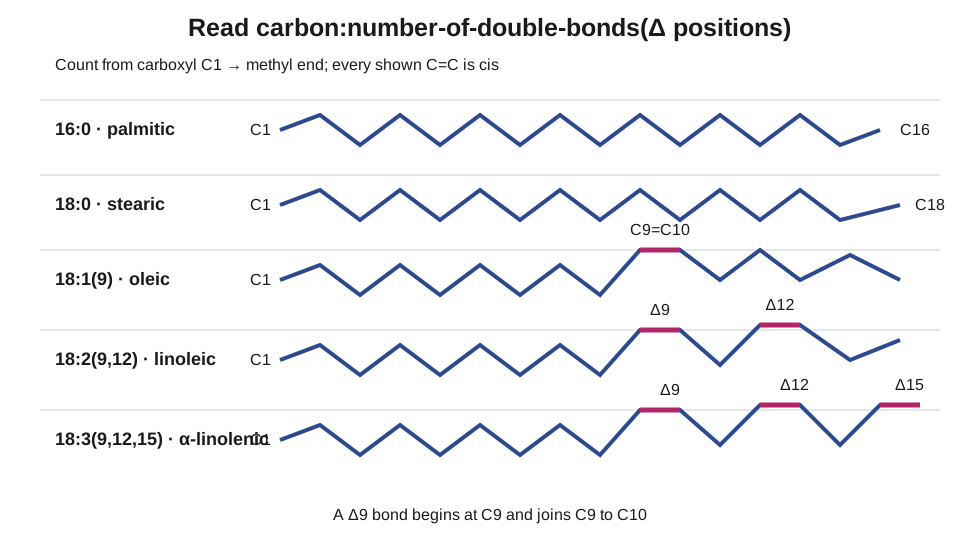
What we know: In 18:2(9,12), 18 is the total carbon count, 2 is the number of double bonds, and 9/12 identify the first carbon of each double bond. Counting begins at the carboxyl carbon. [N-S2 §6]
Knowledge needed: A double bond beginning at Δ9 lies between C9 and C10; the assigned unsaturated chains use cis geometry. [N-S2 §6]
Reasoning—why this step: Decoding before attachment separates chain errors from glycerol-backbone errors. [N-S2 §§6–8]
Work: Write the table: 16:0 = palmitic, no C=C; 18:0 = stearic, no C=C; 18:1(9) = oleic, cis C9=C10; 18:2(9,12) = linoleic, cis C9=C10 and C12=C13; 18:3(9,12,15) = α-linolenic, those two plus cis C15=C16. [HW1 p.1] [N-S2 §6]
Checkpoint: Every assigned chain now has a name, total carbon count, and explicit double-bond positions. [HW1 p.1]
Step 2 — Number glycerol and form ester bonds
What we know: Glycerol has three numbered carbons. Fatty acids attach when glycerol hydroxyls form ester bonds with fatty-acid carboxyl groups. [N-S2 §7]
Knowledge needed: The bond motif to show is glycerol–O–C(=O)–fatty-acyl chain, not a direct carbon-to-carbon link. [N-S2 §7]
Reasoning—why this step: Numbering the backbone before adding chains prevents confusing the special C3 headgroup position in phospholipids. [N-S2 §§7–8]
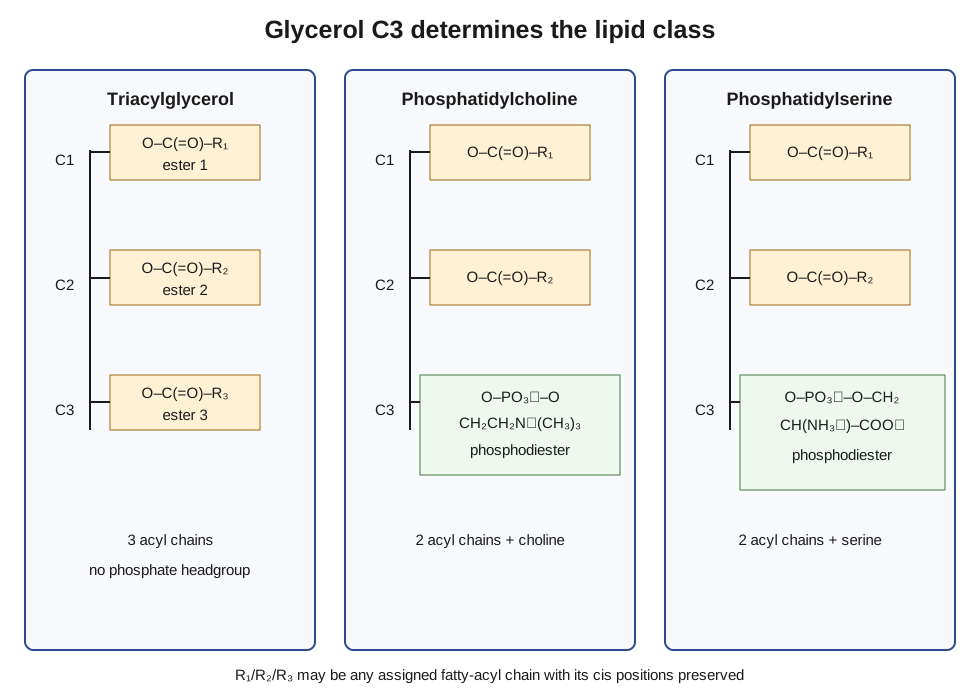
Work: Draw vertical glycerol as C1–C2–C3. As a class scaffold, put an O–C(=O)–R ester at all three carbons for triacylglycerol or only at C1 and C2 for a phospholipid, and label this R-group sketch scaffold—not a fully specified answer. Then replace every R with a complete assigned acyl chain in the requested molecule. [HW1 p.1] [N-S2 §§7–8]
Checkpoint: The triacylglycerol has three ester bonds; each phospholipid has two ester bonds and an unused C3 oxygen ready for phosphate. [N-S2 §§7–8]
Step 3 — Add the C3 group that defines each lipid class
What we know: Triacylglycerol places a third fatty acid at C3. Phosphatidylcholine and phosphatidylserine place phosphate at C3 and join choline or serine through the second phosphate ester. [N-S2 §§7–8]
Knowledge needed: A phosphate joined to glycerol and a headgroup forms a phosphodiester; choline and serine must not be exchanged. [N-S2 §8]
Reasoning—why this step: The C3 substituent is the class-defining decision after the common C1/C2 diacylglycerol foundation. [N-S2 §§7–8]
Work: Finish one allowed triacylglycerol example with three fully drawn assigned acyl chains; it is neutral. Finish one phosphatidylcholine example as glycerol–O–PO₃⁻–O–CH₂CH₂N⁺(CH₃)₃ with two fully drawn assigned chains; phosphate −1 plus choline +1 gives net 0. Finish one pH-7 phosphatidylserine example as glycerol–O–PO₃⁻–O–CH₂–CH(NH₃⁺)–COO⁻ with fully drawn palmitate at C1 and stearate at C2; phosphate −1, NH₃⁺ +1, and COO⁻ −1 give net −1. [HW1 p.1] [N-S2 §8]
Checkpoint: The three drawings now differ correctly at C3: acyl chain, phosphocholine, or phosphoserine. [N-S2 §§7–8]
Step 4 — Substitute any requested chain and audit it
What we know: The directive permits any combination of the five named fatty acids. [HW1 p.1]
Knowledge needed: The acyl chain loses the fatty acid's hydroxyl as the ester forms, but its carbon count and cis double-bond positions remain the same. [N-S2 §§6–8]
Reasoning—why this step: A generic `R` backbone demonstrates class logic, but the assigned skill also requires expanding each requested R into the correct numbered chain. [HW1 p.1]
Work: For each attachment, replace R with the chosen 16- or 18-carbon chain, retain C1 as the carbonyl carbon, and re-mark every specified cis C=C. Circle three esters in triacylglycerol; in each phospholipid circle two esters and one phosphodiester link spanning glycerol–phosphate–headgroup. [N-S2 §§6–8]
Checkpoint: Bond count, chain length, unsaturation, glycerol position, and headgroup identity all match the requested molecule. [HW1 p.1] [N-S2 §§6–8]
Final answer
Use the two figures as the complete construction key. The five chains are palmitic 16:0, stearic 18:0, oleic 18:1(9), linoleic 18:2(9,12), and α-linolenic 18:3(9,12,15), with cis double bonds numbered from carboxyl C1 and the acid/COO⁻ charge shown as requested. Triacylglycerol has three explicit ester-linked chains and is neutral. Phosphatidylcholine has two chains plus its C3 phosphodiester and is net 0; phosphatidylserine has two chains plus its C3 phosphodiester and is net −1 at pH 7. A generic R-group drawing is only a class scaffold, never the completed requested structure. [HW1 p.1] [N-S2 §§6–8]
Why the answer makes sense
The class audit is independent of which fatty acids are chosen: three glycerol hydroxyls become three esters in a triacylglycerol, while a phospholipid uses two for acyl esters and the third for phosphate/headgroup attachment. If a phospholipid has three fatty acids or lacks a phosphodiester, its bond inventory cannot match that pattern. [N-S2 §§7–8]
Common mistakes
- Counting a Δ position from the methyl end moves every double bond to the wrong carbon. [N-S2 §6]
- Drawing trans rather than cis geometry removes the course-specified kink. [N-S2 §6]
- A direct glycerol–chain bond is not the required ester motif. [N-S2 §7]
- Putting a third fatty acid on PC/PS or a phosphate on triacylglycerol changes the lipid class. [N-S2 §§7–8]
- Leaving
R₁,R₂, orR₃in the submitted molecule stops at a scaffold and does not draw the assigned fatty-acid structure. [HW1 p.1]
3. Q1: DNA microarray

Problem
HW1 identifier and page: Q1, page 1. [HW1 Q1]
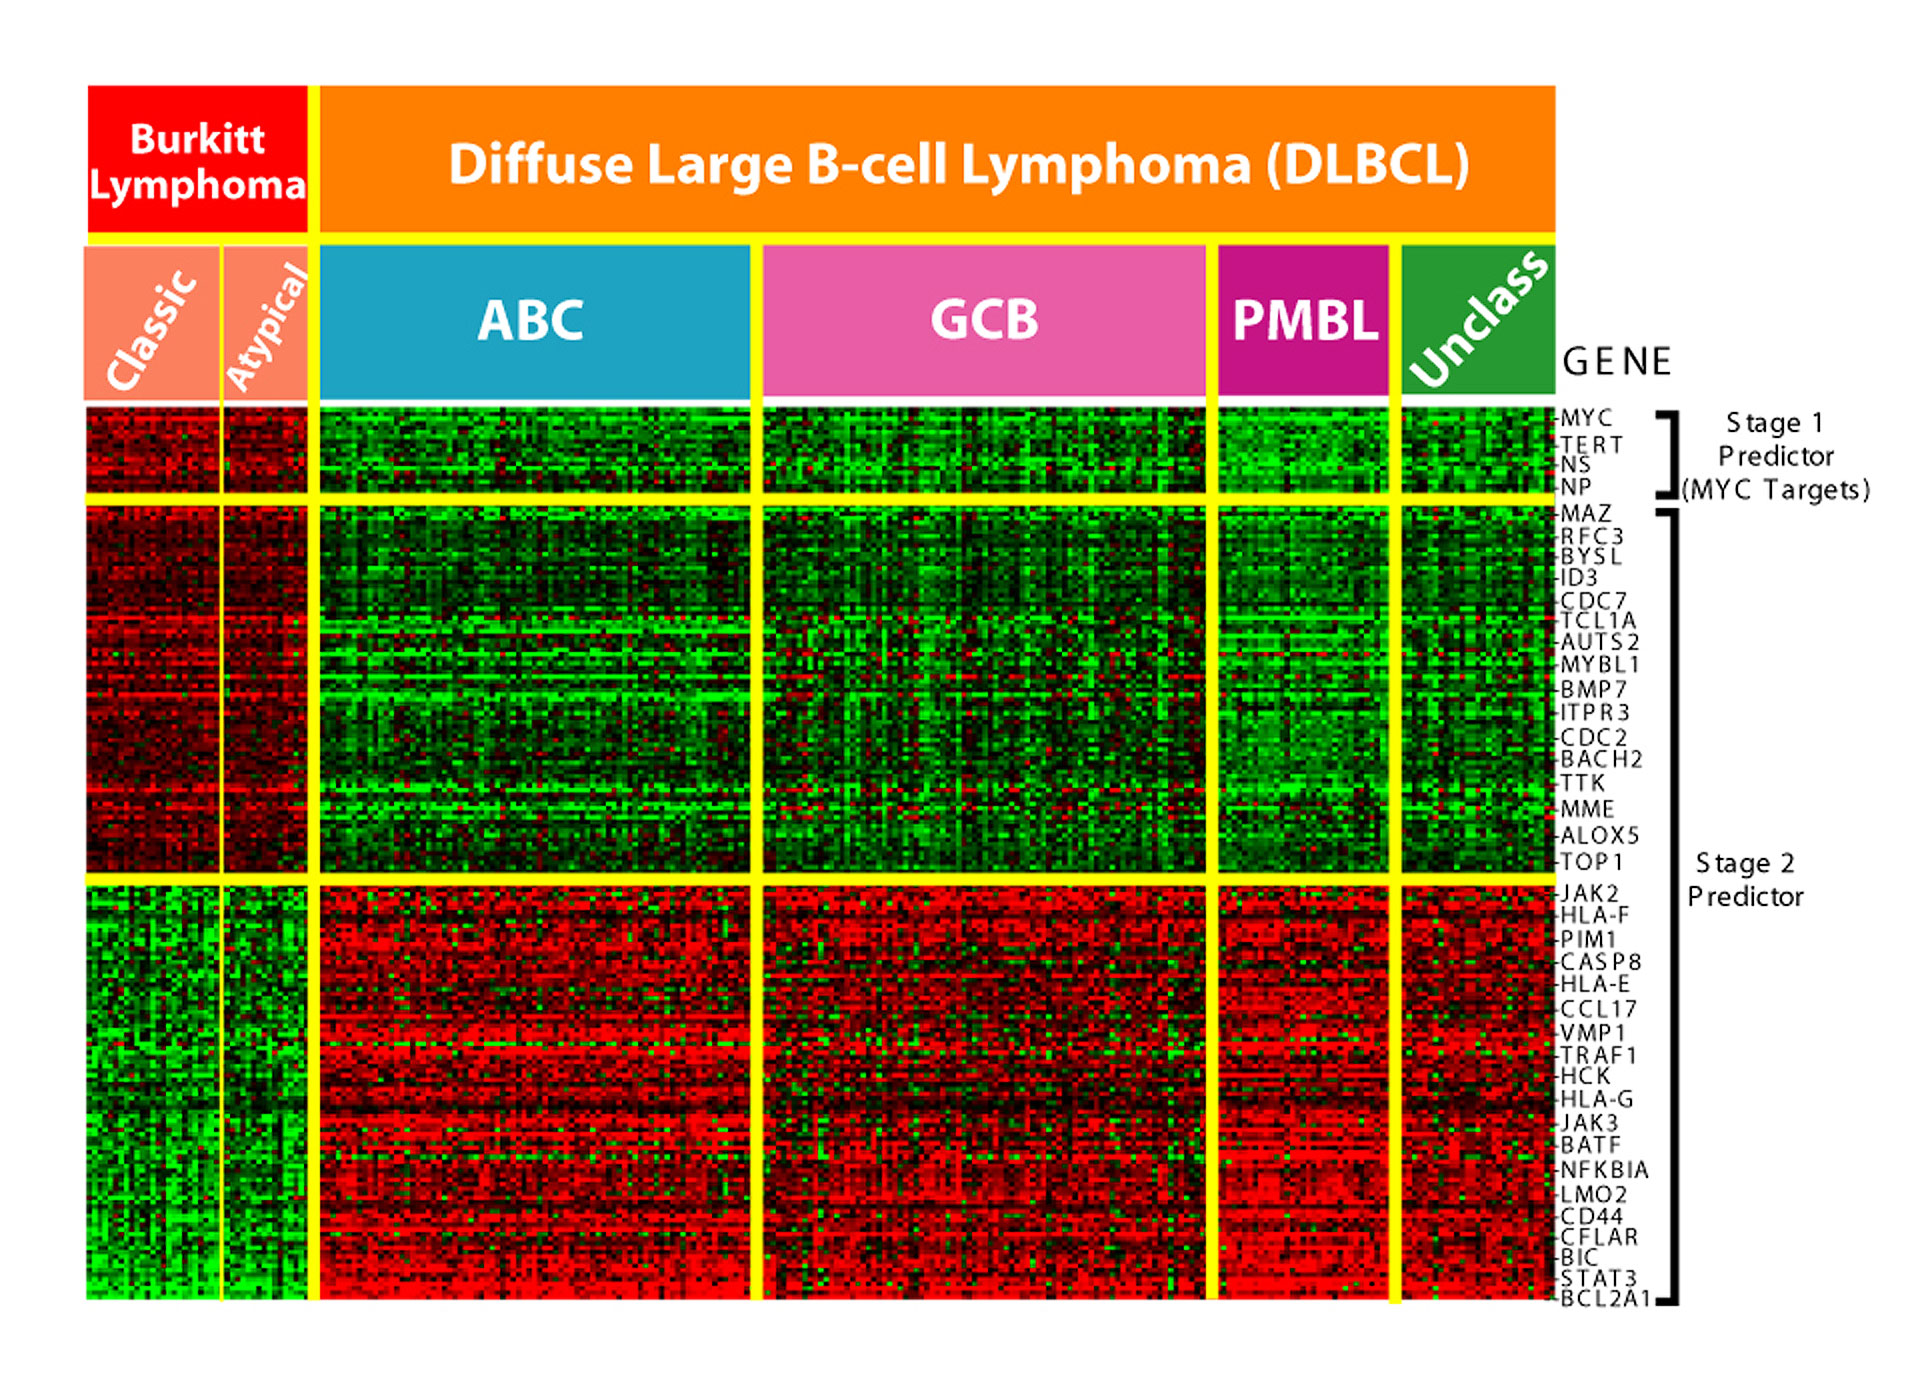
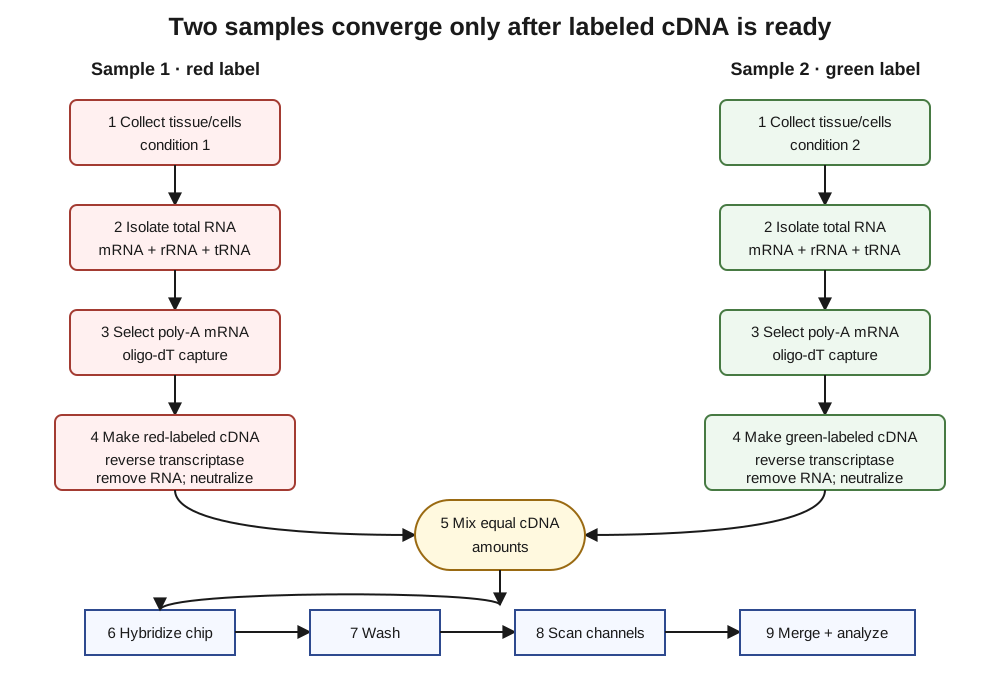
Plain-language restatement: Explain how two biological conditions are compared with a DNA microarray—from collecting samples through reading the chip—and interpret the four merged scanner colors. [HW1 Q1] [N-S2 §§9–16]
Given: Two samples can be assigned different fluorescent cDNA labels; mRNA is selected through its poly-A tail, and the two labeled cDNA populations compete for complementary chip spots. [N-S2 §§9–16]
Find: The complete ordered laboratory workflow and meanings of red, green, yellow, and black. [HW1 Q1]
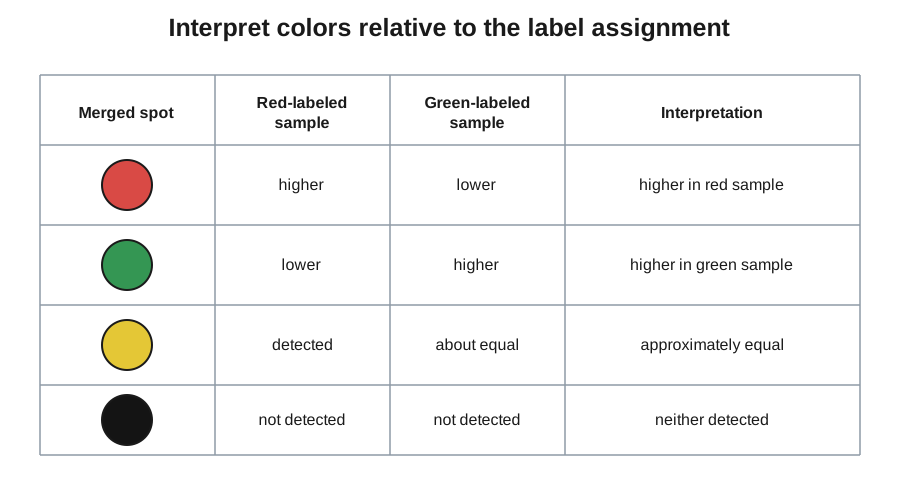
Required answer form: A narrated workflow plus explicit color meanings relative to named sample labels. [N-S2 §16]
Solution roadmap
Keep the two samples separate while isolating RNA, selecting mRNA, and making differently labeled cDNA; remove the RNA template and neutralize; combine equal cDNA amounts on the chip; wash and scan both channels; then interpret each color relative to the original label assignment. [N-S2 §§9–16]
Detailed A–Z walkthrough
Step 1 — Define the comparison before doing chemistry
What we know: Microarray colors are comparative, so every interpretation depends on which condition received each fluorescent label. [N-S2 §§13, 16]
Knowledge needed: A color is not an intrinsic property of a gene; it reports the relative contribution of two labeled samples at one chip spot. [N-S2 §16]
Reasoning—why this step: Naming “sample 1 = red” and “sample 2 = green” at the start prevents an otherwise correct workflow from ending with reversed interpretations. [N-S2 §16]
Work: Write two lanes: condition 1/tissue 1 → red label; condition 2/tissue 2 → green label. Maintain that mapping through every subsequent stage. [N-S2 §§13, 16]
Checkpoint: The experimental comparison and color legend are fixed before the samples converge. [N-S2 §16]
Step 2 — Isolate total RNA, then select mRNA
What we know: Cells contain rRNA, tRNA, and mRNA; mRNA has a poly-A tail that binds an oligo-dT selection surface while other RNA passes through. [N-S2 §§9–12]
Knowledge needed: The desired signal is gene expression, so the messenger-RNA fraction—not total cellular RNA—is carried forward. [N-S2 §§9–12]
Reasoning—why this step: Selecting poly-A RNA enriches the templates that correspond to expressed genes and removes abundant RNA types that are not the intended measurement. [N-S2 §§9–12]
Work: Lyse each sample separately, isolate total RNA, pass it across immobilized oligo-dT, wash away rRNA/tRNA, and elute the retained poly-A mRNA. [N-S2 §§9–12]
Checkpoint: Each lane contains an mRNA-enriched pool that still preserves the original biological condition. [N-S2 §§9–12]
Step 3 — Make and label cDNA, then remove RNA
What we know: Reverse transcriptase uses mRNA with an oligo-dT primer and dNTPs to make stable cDNA; each sample receives a distinct fluorescent label. NaOH plus heat destroys RNA, after which the mixture must be neutralized. [N-S2 §§13–14]
Knowledge needed: The chip receives labeled DNA, not intact RNA/cDNA hybrids, and hydrogen-bonding hybridization requires restored suitable pH. [N-S2 §§13–15]
Reasoning—why this step: cDNA preserves the expression information in a stable, fluorescent form, while RNA removal prevents the template strand from blocking later chip pairing. [N-S2 §§13–15]
Work: Add oligo-dT primer, reverse transcriptase, dNTPs, and the lane's fluorescent label; synthesize cDNA; treat with NaOH and heat to destroy RNA; then neutralize. [N-S2 §§13–14]
Checkpoint: There are now two single-stranded cDNA populations with distinct, known labels. [N-S2 §§13–14]
Step 4 — Hybridize, wash, scan, and merge
What we know: Equal amounts of the two labeled cDNA pools are combined, applied to complementary DNA spots on the chip, allowed to hybridize, washed, and scanned in the two channels. [N-S2 §§15–16]
Knowledge needed: A spot's channel intensity reflects how much complementary labeled cDNA remained bound after washing. [N-S2 §16]
Reasoning—why this step: Equal input and competitive hybridization make the merged signal a relative comparison between conditions rather than a comparison of how much sample was loaded. [N-S2 §§15–16]
Work: Mix equal labeled cDNA amounts, cover the chip, allow complementary strands to pair, wash off unbound material, scan red and green fluorescence separately, and superimpose the channel images. [N-S2 §§15–16]
Checkpoint: Each gene spot now has red intensity, green intensity, both, or neither. [N-S2 §16]
Step 5 — Interpret all four colors
What we know: Red signal comes from the red-labeled condition and green from the green-labeled condition; overlap appears yellow, and absence of both signals appears black. [N-S2 §16]
Knowledge needed: “Higher,” “approximately equal,” and “not detected” are relative measurement statements, not absolute descriptions of the gene. [N-S2 §16]
Reasoning—why this step: Color interpretation is the final mapping back from scanner output to the two biological samples defined in Step 1. [N-S2 §16]
Work: Red = higher expression in the red-labeled sample; green = higher in the green-labeled sample; yellow = approximately equal detectable expression in both; black = no detected expression in either. [N-S2 §16]
Checkpoint: Every possible merged spot color has an interpretation tied to the original label assignment. [N-S2 §16]
Final answer
The complete sequence is define two samples → isolate total RNA → select poly-A mRNA → make differently labeled cDNA → destroy RNA and neutralize → mix equal cDNA amounts → hybridize to the chip → wash → scan both channels → merge and interpret. Red means higher expression in the red-labeled sample, green means higher in the green-labeled sample, yellow means approximately equal detected expression, and black means neither sample is detected at that spot. [HW1 Q1] [N-S2 §§9–16]
Why the answer makes sense
Swapping the fluorescent labels would leave every wet-lab operation unchanged but reverse red/green biological interpretations; yellow and black would keep their meanings. That independent label-swap test confirms that colors are comparative readouts, not gene identities. [N-S2 §§13, 16]
Common mistakes
- Carrying total RNA straight to the chip skips the poly-A selection that isolates mRNA. [N-S2 §§9–12]
- Calling the labeled product RNA ignores the reverse-transcription step that makes cDNA. [N-S2 §13]
- Destroying RNA without neutralizing can prevent the intended hydrogen-bonding hybridization. [N-S2 §14]
- Interpreting red/green without naming the original label assignment makes the conclusion ambiguous. [N-S2 §16]
4. Q2: Microcalorimetry

Problem
HW1 identifier and page: Q2, pages 1–2. [HW1 Q2]
Plain-language restatement: Plot control and pesticide-treated spinach heat rates through water/NaOH/water phases A/B/C, calculate all missing plateaus, use the NaOH phase to assess CO₂-associated heat, validate with phase C, and conclude what the pesticide did. [HW1 Q2]
Given: Control A is 75 μW/mg and rises 20% in B. Treated A is 30% below control A and does not change in B. A/C use water; B uses 40 μL 0.4 M NaOH in the separate well. [HW1 Q2]
Find: Both labeled traces, both C predictions, B−A for each ampule, and the supported biological conclusion. [HW1 Q2]
Required answer form: Heat rate (μW/mg dry weight) versus time with A/B/C phases, followed by calculations and a causal interpretation. [HW1 Q2] [N-S3 §§6–8]
Solution roadmap
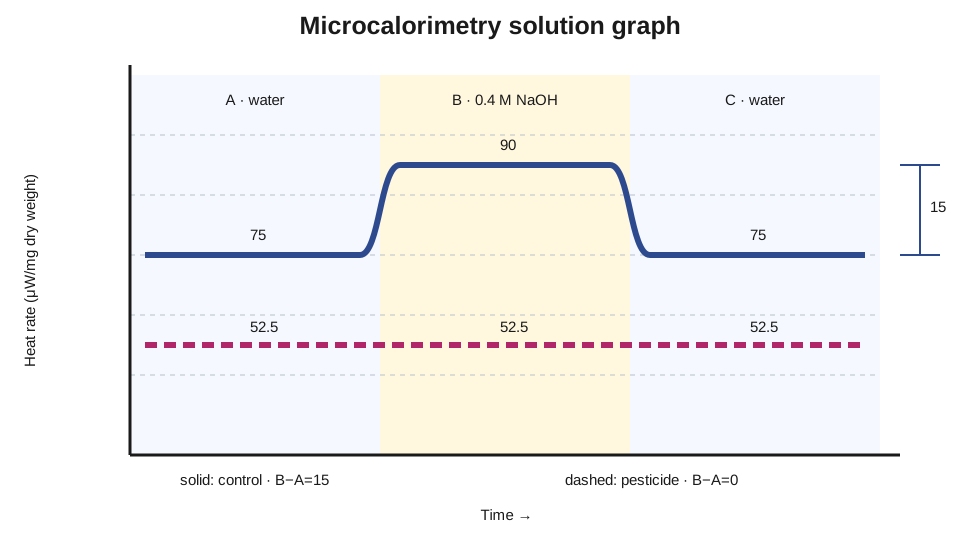
Label axes and phases; calculate control B as 75×1.20=90; calculate treated A as 75×0.70=52.5; carry each A value into C; plot 75→90→75 and 52.5→52.5→52.5; compare B−A within each ampule; use each C return to validate the comparison; conclude that pesticide treatment lowers heat rate and reduces CO₂ production to non-detectable levels in this assay. [HW1 Q2] [KEY Q2] [N-S3 §§6–8]
Detailed A–Z walkthrough
Step 1 — Decode apparatus, axes, and A/B/C conditions
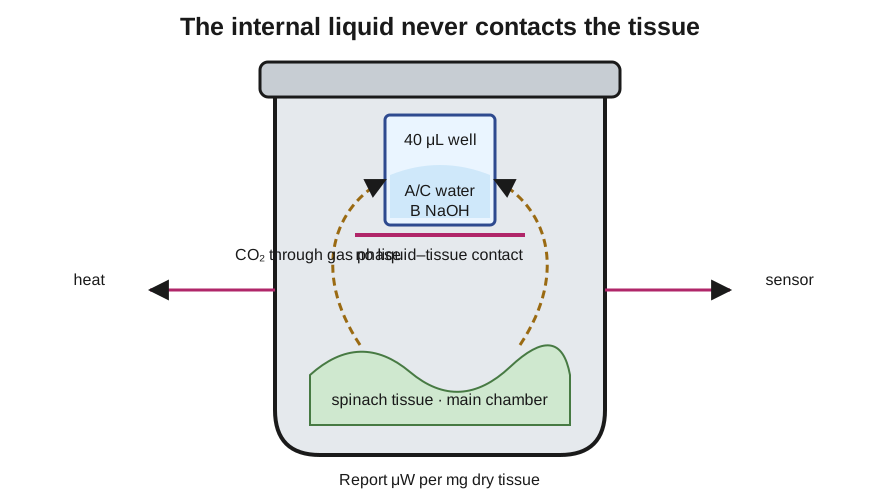
What we know: Tissue sits in the main sealed ampule chamber while about 40 μL of water or NaOH sits in a separate internal well; the well liquid does not contact the tissue. Heat rate is normalized to dry tissue mass. [HW1 Q2] [N-S3 §§4–7]
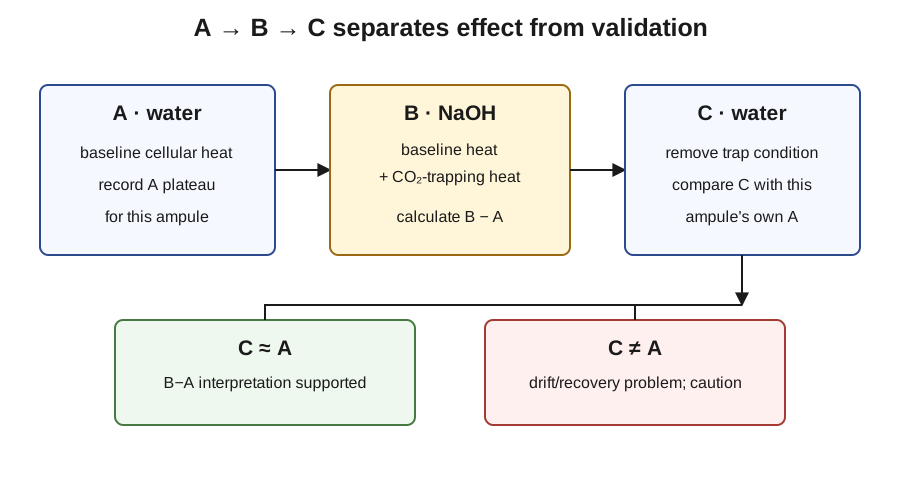
Knowledge needed: Part A is the water baseline, Part B adds heat from exothermic CO₂ trapping by excess NaOH, and Part C restores water as a return-to-baseline control. [N-S3 §§6–8]
Reasoning—why this step: The graph is interpretable only after separating tissue metabolism from heat released when gaseous CO₂ reaches the NaOH well. [N-S3 §7]
Work: Put time on x and heat rate (μW/mg dry weight) on y. Mark three intervals: A water, B NaOH, C water. Prepare distinct solid/dashed trace styles for ampules 1 and 2. [HW1 Q2] [N-S3 §§6–8]
Checkpoint: The graph now states what is measured, when the trap is present, and which ampule each trace represents. [N-S3 §§6–8]
Step 2 — Calculate all six plateaus
What we know: Control A is 75 μW/mg; control B is a 20% increase. Treated A is a 30% decrease relative to control A; treated B equals treated A. Each valid C should return to its own A baseline. [HW1 Q2] [N-S3 §8]
Knowledge needed: A percentage increase uses starting value×(1+decimal); a decrease uses starting value×(1−decimal). [HW1 Q2]
Reasoning—why this step: Computing the plateaus before plotting prevents percent changes from being drawn as unlabeled or arbitrary vertical distances. [HW1 Q2]
Work: Control B: 75 μW/mg × (1+0.20) = 90 μW/mg. Treated A: 75 μW/mg × (1−0.30) = 52.5 μW/mg. Treated B is stated equal to A, so it is 52.5 μW/mg. Control C returns to 75; treated C returns to 52.5. [HW1 Q2] [KEY Q2]
Checkpoint: Ampule 1 is 75, 90, 75; ampule 2 is 52.5, 52.5, 52.5, all in μW/mg. [KEY Q2]
Step 3 — Plot both traces and calculate the within-ampule effect
What we know: B−A isolates the extra heat associated with trapping CO₂ within the same ampule. [N-S3 §7]
Knowledge needed: The treatment comparison must not confuse a lower general A baseline with the A-to-B trap response. [N-S3 §§6–8]
Reasoning—why this step: Two comparisons answer two questions: between-ampule A values compare overall heat rate, while within-ampule B−A compares detectable CO₂-associated heat. [KEY Q2] [N-S3 §7]
Work: Plot the control solid trace at 75 in A, 90 in B, and 75 in C. Plot the treated dashed trace at 52.5 across all phases. Then calculate control B−A = 90−75 = 15 μW/mg and treated B−A = 52.5−52.5 = 0 μW/mg. [HW1 Q2] [KEY Q2]
Checkpoint: The treated sample has both a 22.5 μW/mg lower A baseline and no detected A-to-B increment. [KEY Q2]
Step 4 — Validate with C and state only the supported conclusion
What we know: C returns the well to water; returning to each ampule's own A supports attributing the temporary B difference to the NaOH condition rather than continuing drift. [N-S3 §8]
Knowledge needed: The key interprets the treated sample's lower A as reduced heat rate and its zero B−A as CO₂ production reduced to non-detectable levels. [KEY Q2]
Reasoning—why this step: Validation must precede causal interpretation; otherwise a permanent time-dependent change could be mistaken for a NaOH trap effect. [N-S3 §8]
Work: Confirm control C=A=75 and treated C=A=52.5. Because both return checks pass, report the two observed treatment effects and avoid extending beyond the course conclusion. [KEY Q2] [N-S3 §8]
Checkpoint: The graph, arithmetic, validation, and conclusion now form one evidence chain. [KEY Q2]
Final answer
The required graph is control: 75 → 90 → 75 μW/mg and pesticide-treated: 52.5 → 52.5 → 52.5 μW/mg across A/B/C. Control B−A=15 μW/mg; treated B−A=0 μW/mg. Since each C returns to its own A baseline, the result supports that the pesticide reduces leaf heat rate and reduces CO₂ production to non-detectable levels in this assay. [KEY Q2] [N-S3 §§7–8]
Why the answer makes sense
The percentage arithmetic is reversible: 90/75=1.20 and 52.5/75=0.70. The causal pattern also has the correct controls: only the control sample gains trapping heat in B, and both samples recover their original A values in C. [HW1 Q2] [KEY Q2]
Common mistakes
- Adding 20 units rather than 20% gives 95 instead of
75×1.20. [HW1 Q2] - Taking 30% off the treated value rather than the stated control A changes the reference point. [HW1 Q2]
- Comparing 90 directly with 52.5 without calculating each ampule's own B−A confounds overall heat and CO₂-associated heat. [N-S3 §7]
- Setting both C values to 75 ignores that C returns each ampule to its own baseline. [N-S3 §8]
5. Q3a: Enzyme-kinetics graph
Problem
HW1 identifier and page: Q3a, page 2. [HW1 Q3a]
Plain-language restatement: For the one-cuvette LDH assay described immediately before Q3a, identify the axes of the graph used to measure the enzyme's initial activity. Then distinguish that time trace from the separate multi-assay Michaelis–Menten graph. [HW1 Q3a] [N-S4 §19]
Given: The mixed assay is followed in one cuvette at 340 nm. NADH is initially present, LDH consumes it, and the course measures A₃₄₀ on the y-axis as a function of elapsed time. The initial straight segment has a negative slope. [HW1 Q3] [N-S4 §§12, 19]
Find: The primary graph's independent variable, dependent variable, axis units, trace direction, and initial-velocity meaning, plus the corresponding meanings on the contrasting [S]-versus-v₀ graph. [N-S1 §18] [N-S4 §19]
Required answer form: A labeled single-cuvette trace with elapsed time on x and A₃₄₀ on y, showing the descending initial linear region whose slope supplies the assay's initial velocity. Include [S] on x and v₀ on y only in an explicitly labeled multi-assay contrast. [HW1 Q3a] [N-S1 §18] [N-S4 §19]
Solution roadmap
Read Q3a in the context of the single mixed cuvette: elapsed time advances on x, the spectrophotometer measures A₃₄₀ on y, and the initial straight segment slopes downward as NADH is consumed. Define this trace's initial velocity from the magnitude of that initial slope. Then contrast it with the multi-assay graph, where separate cuvettes vary [S] and contribute one v₀ value each to a rising saturation curve. [HW1 Q3] [N-S1 §18] [N-S4 §19]
Detailed A–Z walkthrough
Step 1 — Assign the one-cuvette variables
What we know: The assay is mixed once in a cuvette, then the spectrophotometer repeatedly measures A₃₄₀ as time passes. [HW1 Q3] [N-S4 §19]
Knowledge needed: The deliberately set quantity is independent; the measured response is dependent. [N-S1 §18]
Reasoning—why this step: Axis assignment follows what this experiment actually varies and records, not the shape of a different kinetics graph remembered from class. [N-S1 §18] [N-S4 §19]
Work: Independent variable = elapsed time, in seconds or minutes, on x. Dependent variable = A₃₄₀, a unitless spectrophotometer reading, on y. At time zero A₃₄₀ is high because NADH is present. [N-S4 §§17, 19]
Checkpoint: The graph answers "what did the cuvette's absorbance do over time?" rather than "how did rate vary across substrate concentrations?" [N-S4 §19]
Step 2 — Draw the initial trace and define its velocity
What we know: NADH absorbs at 340 nm and is consumed in the forward LDH reaction, so the observed A₃₄₀ falls. The course calculation uses the trace's initial linear region. [N-S4 §§12, 19]
Knowledge needed: On this raw trace, "initial velocity" means the magnitude of the initial ΔA₃₄₀/Δtime slope; Beer's Law converts that absorbance-rate magnitude to a concentration rate when required. It is not the y-axis itself. [N-S4 §§17, 19–20]
Reasoning—why this step: The early slope is used because later curvature no longer represents the constant initial-rate region needed for the calculation. [N-S4 §19]
Work: Start at a high A₃₄₀ value at t=0, draw a straight descending initial segment, and show later flattening only after that usable segment. Mark the initial slope ΔA₃₄₀/Δtime < 0; define assay v₀ as its positive magnitude after any needed Beer's-Law conversion. [N-S4 §19–20]
Checkpoint: A working LDH sample slopes downward initially; a flat trace would indicate no measurable NADH consumption under the assay conditions. [N-S4 §19]
Step 3 — Contrast the multi-assay Michaelis–Menten graph
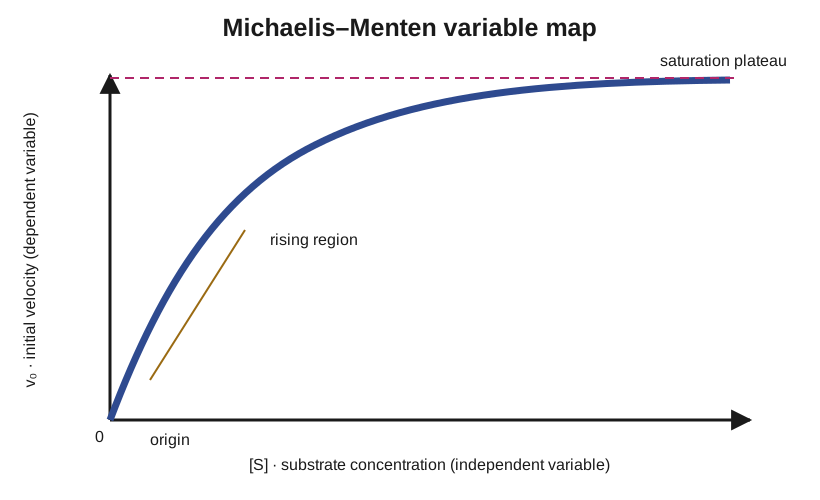
What we know: A different experiment prepares multiple assays at different substrate concentrations. One initial rate is extracted from each assay, and plotting those rates against [S] produces the course Michaelis–Menten hyperbola. [N-S1 §18]
Knowledge needed: On this contrast graph, [S] is the independent x-variable and v₀ is the dependent y-variable; here v₀ means the initial reaction rate derived from each separate time trace. [N-S1 §18] [N-S4 §19]
Reasoning—why this step: Keeping the two levels separate prevents one raw cuvette trace from being mislabeled as a many-assay rate curve. [N-S1 §18] [N-S4 §19]
Work: Draw a smaller contrast panel with [S] on x and v₀ on y. Begin at the origin, rise hyperbolically, and approach a saturation plateau. Connect the panels with many A₃₄₀-versus-time traces → one initial v₀ from each → [S]-versus-v₀ curve. [N-S1 §18] [N-S4 §19]
Checkpoint: The primary panel is one cuvette over time; the contrast panel summarizes many cuvettes across [S]. Each use of "initial velocity" now has an explicit referent. [N-S1 §18] [N-S4 §19]
Final answer
For the Q3 assay graph, plot elapsed time on the x-axis and A₃₄₀ on the y-axis. Begin at high A₃₄₀ and draw a descending initial linear region because NADH is consumed; the magnitude of that initial slope supplies the assay's initial velocity, with Beer's Law used when a concentration rate is needed. In the explicit multi-assay contrast only, plot [S] on x and one derived v₀ per assay on y to obtain the rising Michaelis–Menten saturation curve. [HW1 Q3a] [N-S1 §18] [N-S4 §19]
Why the answer makes sense
The primary graph matches the actual measurement sequence: the instrument records A₃₄₀ repeatedly while time advances, and NADH consumption requires a negative initial slope. The contrast graph also remains internally consistent because each of its y-values is derived from one separate trace before being plotted against the [S] chosen for that assay. [N-S1 §18] [N-S4 §19]
Common mistakes
- Making
[S] → v₀the primary Q3a answer skips the single-cuvette time trace established by the assay stem; that curve belongs only in the explicit multi-assay contrast. [HW1 Q3] [N-S1 §18] [N-S4 §19] - Putting
v₀directly on the raw trace's y-axis confuses a slope-derived rate with the measured A₃₄₀ signal. [N-S4 §19] - Averaging the whole curved trace instead of using its initial straight region does not give the course initial velocity. [N-S4 §19]
- Reporting the negative slope as negative enzyme activity confuses direction of signal change with the positive magnitude used for activity. [N-S4 §19–20]
6. Q3b: Absorbance slope

Problem
HW1 identifier and page: Q3b, page 2. [HW1 Q3b]
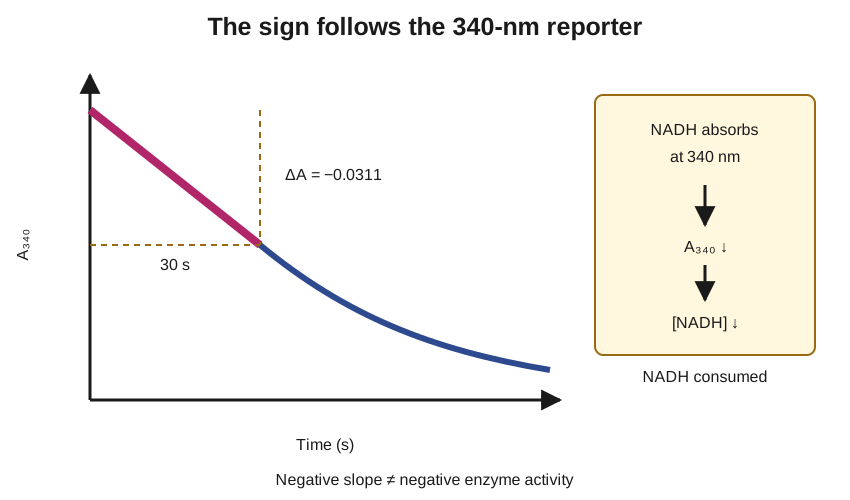
Plain-language restatement: Explain what the negative sign in the measured ΔA₃₄₀/30 s = −0.0311 says about the LDH assay. [HW1 Q3b]
Given: NADH absorbs at 340 nm; NAD⁺ and the other stated components do not provide that reporter signal. LDH runs pyruvate + NADH + H⁺ ⇌ lactate + NAD⁺. [N-S4 §§12, 19]
Find: The direction of NADH concentration change and its biochemical meaning. [HW1 Q3b]
Required answer form: A sign interpretation tied explicitly to the absorbing compound and reaction direction; do not report negative enzyme activity. [KEY Q3b] [N-S4 §20]
Solution roadmap
Identify NADH as the 340-nm reporter; use A=εLC to map falling absorbance to falling NADH concentration; connect NADH loss to the LDH reaction; conclude that NADH is consumed as pyruvate is reduced to lactate. [KEY Q3b] [N-S4 §§12, 17, 19]
Detailed A–Z walkthrough
Step 1 — Identify what the instrument sees
What we know: In this assay, NADH is the species monitored at 340 nm. [N-S4 §§12, 19]
Knowledge needed: A spectrophotometer reports absorbance, so the chemical interpretation must begin with the species whose absorbance changes. [N-S4 §§17, 19]
Reasoning—why this step: The slope sign cannot be assigned to a reaction participant until the optical reporter is named. [N-S4 §19]
Work: Write reporter at 340 nm = NADH, not NAD⁺, pyruvate, or lactate. [N-S4 §12]
Checkpoint: The measured signal is linked to one molecular concentration. [N-S4 §12]
Step 2 — Translate the slope sign through Beer's Law
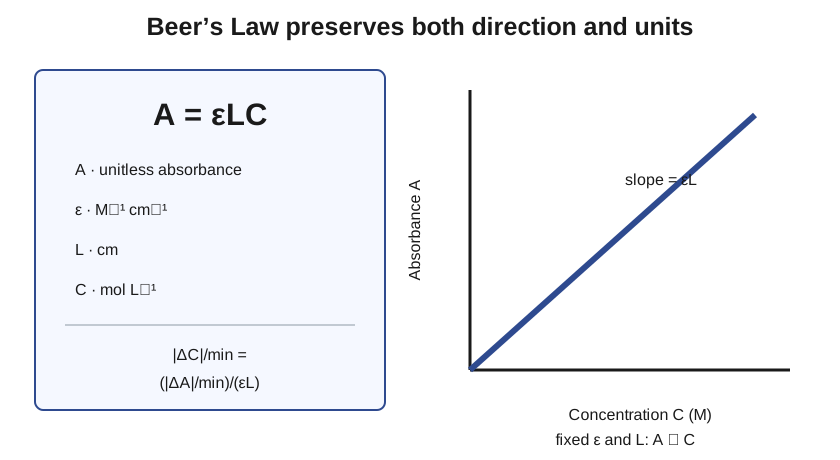
What we know: A=εLC; ε and L are positive and fixed during the cuvette reading. [N-S4 §17]
Knowledge needed: With ε and L constant, absorbance and concentration change in the same direction. [N-S4 §17]
Reasoning—why this step: This proportionality is the bridge from a negative optical slope to a chemical concentration decrease. [N-S4 §17]
Work: ΔA₃₄₀<0 → Δ[NADH]<0. The value −0.0311/30 s therefore means NADH concentration falls during the measured interval. [HW1 Q3b] [N-S4 §§17, 19]
Checkpoint: The sign has been interpreted without yet confusing it with the positive magnitude used for IU. [N-S4 §20]
Step 3 — Map NADH loss to the LDH reaction
What we know: LDH couples pyruvate reduction to lactate with oxidation of NADH to NAD⁺. [N-S1 §15] [N-S4 §12]
Knowledge needed: Consuming a reactant moves the written reaction forward under the assay condition. [N-S1 §15]
Reasoning—why this step: Naming only “the absorbance decreases” stops at instrument behavior; the question asks for biochemical meaning. [HW1 Q3b]
Work: Write pyruvate + NADH + H⁺ → lactate + NAD⁺; underline NADH on the reactant side and connect it to the falling 340-nm signal. [N-S1 §15] [N-S4 §12]
Checkpoint: The optical observation now reports forward LDH reaction progress and NADH consumption. [KEY Q3b]
Final answer
The minus sign means A₃₄₀ decreases, so the measured compound NADH is being consumed as the LDH reaction proceeds toward lactate and NAD⁺. It does not mean the enzyme has negative activity. [KEY Q3b] [N-S4 §§12, 20]
Why the answer makes sense
If NADH is removed, the concentration of the only stated 340-nm reporter falls; with positive fixed ε and L, Beer's Law requires absorbance to fall too. An inactive-enzyme control would instead be expected to have an approximately flat initial trace. [N-S4 §§12, 17, 19]
Common mistakes
- Calling the result “negative IU” confuses a signed signal slope with a positive rate magnitude. [N-S4 §20]
- Naming NAD⁺ as the 340-nm reporter reverses the course assay logic. [N-S4 §12]
- Reading the later curved region instead of the initial linear region gives a different rate. [N-S4 §19]
7. Q3c: LDH activity in IU
Problem
HW1 identifier and page: Q3c, page 2. [HW1 Q3c]
Plain-language restatement: Convert the measured 340-nm absorbance decrease into the amount of LDH activity present in the 1.00 mL cuvette. [HW1 Q3c]
Given: ΔA₃₄₀/30 s=−0.0311, ε=6220 M⁻¹cm⁻¹, path length L=1 cm, assay volume 1.00 mL, and 1 IU=1 μmol/min. [HW1 Q3c] [N-S4 §§17, 20]
Find: Positive LDH activity in IU. [HW1 Q3c]
Required answer form: A complete unit chain from absorbance per minute through molarity per minute and amount per minute to IU. [N-S4 §20]
Dependency: Q3b establishes why the raw slope is negative; this calculation uses its positive magnitude for activity. [KEY Q3b–c]
Solution roadmap
Convert 30 s to 1 min; take |ΔA|; divide by εL to get mol L⁻¹ min⁻¹; multiply by 0.001 L; convert mol to μmol; identify μmol/min as IU. Final result: 0.0100 μmol/min = 0.0100 IU ≈ 0.01 IU. [KEY Q3c] [N-S4 §§17, 20]
Detailed A–Z walkthrough
Step 1 — Normalize the absorbance change to one minute
What we know: The measured magnitude is 0.0311 absorbance units per 30 s. [HW1 Q3c]
Knowledge needed: One minute is 60 s, exactly twice the measured interval; activity is reported as a positive magnitude. [N-S4 §20]
Reasoning—why this step: IU contains `per minute`, so the time denominator must be corrected before the spectroscopic conversion. [N-S4 §20]
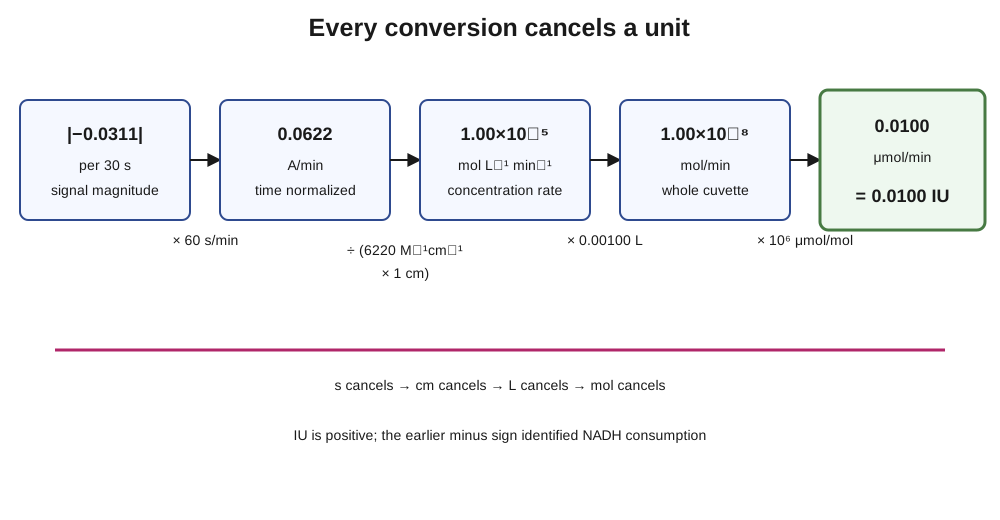
Work: |−0.0311|/30 s × 60 s/1 min = 0.0622 A/min. [HW1 Q3c]
Checkpoint: The rate now has the time unit required by IU and retains the measured signal magnitude. [N-S4 §20]
Step 2 — Use Beer's Law to obtain a concentration rate
What we know: A=εLC, so for a rate at fixed ε and L, |ΔC|/min=(|ΔA|/min)/(εL). [N-S4 §17]
Knowledge needed: (M⁻¹cm⁻¹)(cm)=M⁻¹; dividing a dimensionless absorbance rate by M⁻¹ produces M/min. [N-S4 §17]
Reasoning—why this step: Absorbance is not an amount; it must first be converted into molar concentration change through the stated extinction coefficient and path length. [N-S4 §§17, 20]
Work: 0.0622 min⁻¹ ÷ [(6220 M⁻¹cm⁻¹)(1 cm)] = 1.00×10⁻⁵ M/min = 1.00×10⁻⁵ mol L⁻¹ min⁻¹. [HW1 Q3c]
Checkpoint: The result is a concentration rate, not yet the amount rate required for IU. [N-S4 §20]
Step 3 — Convert concentration rate to amount rate
What we know: The assay volume is 1.00 mL = 0.00100 L. [HW1 Q3]
Knowledge needed: mol L⁻¹ min⁻¹ × L = mol min⁻¹; volume multiplication is the bridge from concentration to amount. [N-S4 §20]
Reasoning—why this step: IU describes how many micromoles react per minute in the entire cuvette, not the molar rate per liter. [N-S4 §20]
Work: 1.00×10⁻⁵ mol L⁻¹ min⁻¹ × 0.00100 L = 1.00×10⁻⁸ mol/min. [HW1 Q3c]
Checkpoint: Liters cancel and the whole-assay amount rate remains. [N-S4 §20]
Step 4 — Convert moles to micromoles and identify IU
What we know: 1 mol=10⁶ μmol and 1 IU=1 μmol/min. [N-S4 §20]
Knowledge needed: Multiplying mol by 10⁶ μmol/mol cancels mol and moves to the larger numerical micromole value. [N-S4 §20]
Reasoning—why this step: The final conversion puts the result in the definition's exact unit; no extra factor belongs after it. [N-S4 §20]
Work: 1.00×10⁻⁸ mol/min × 10⁶ μmol/mol = 1.00×10⁻² μmol/min = 0.0100 IU. [HW1 Q3c] [KEY Q3c]
Checkpoint: The numerical result and unit now match the key: 0.01 IU. [KEY Q3c]
Final answer
|−0.0311|/30 s × 60 s/min ÷ [(6220 M⁻¹cm⁻¹)(1 cm)] × 0.00100 L × 10⁶ μmol/mol = 0.0100 μmol/min. Therefore the cuvette contains 0.0100 IU of LDH, reported as 0.01 IU at the key's precision. [KEY Q3c] [N-S4 §20]
Why the answer makes sense
The unit chain ends in μmol/min with every s, cm, L, and mol factor canceled. The sign is positive because IU is a catalytic-rate magnitude; the negative sign was already used to identify NADH disappearance. [KEY Q3b–c] [N-S4 §20]
Common mistakes
- Failing to double the 30-second change gives half the correct activity. [N-S4 §20]
- Multiplying by ε rather than dividing contradicts
C=A/(εL). [N-S4 §17] - Stopping at M/min reports concentration rate, not total enzyme activity in the cuvette. [N-S4 §20]
- Reporting
−0.01 IUcarries an instrument direction into a magnitude-defined unit. [N-S4 §20]
8. Q3d: pH change during the LDH assay
Problem
HW1 identifier and page: Q3d, page 2. [HW1 Q3d]
Plain-language restatement: Use the two-minute LDH reaction and the assay's actual Tris content to calculate whether pH changes meaningfully from 7.3. [HW1 Q3d]
Given: The 1.00 mL assay contains 900 μL of 200 mM Tris and 30 μL LDH solution in 200 mM Tris; pyruvate and NADH additions are in water. Initial pH is 7.30, Tris pKₐ is 8.21, activity from Q3c is 0.0100 μmol/min, and LDH consumes one H⁺ per NADH. [HW1 Q3] [KEY Q3c] [N-S1 §§14–15]
Find: Initial acid/base amounts, proton equivalents consumed in 2 min, final pH, and whether the change is large. [HW1 Q3d]
Required answer form: Two Henderson–Hasselbalch states with all amount/concentration conversions shown and a before/after conclusion. [KEY Q3d]
Dependency: Use the positive activity magnitude from Q3c and the H⁺-consuming LDH direction established in Q3b. [KEY Q3b–d]
Solution roadmap
Count 0.186 mmol total Tris in 1.00 mL (0.186 M); use 7.30=8.21+log(B/A) to split it into acid and base; calculate 0.0100 μmol/min×2 min=0.0200 μmol H⁺ consumed; convert that to 2.00×10⁻⁵ M; update A−x and B+x; recalculate pH=7.30048≈7.3005, so it remains 7.3 at the stated precision. [KEY Q3d] [N-S1 §§14–15]
Detailed A–Z walkthrough
Step 1 — Count total Tris in the final assay
What we know: Only the 900 μL assay-buffer addition and the 30 μL enzyme solution contain 200 mM Tris; the other 70 μL is water-based substrate/cofactor solution. [HW1 Q3]
Knowledge needed: Moles of buffer are additive and dilution uses the final 1.00 mL assay volume. [N-S1 §16]
Reasoning—why this step: Henderson–Hasselbalch needs the actual buffer pool after mixing, not the stock concentration printed beside one component. [HW1 Q3d]
Work: (0.900 mL+0.030 mL)×0.200 mmol/mL=0.186 mmol Tris. Dividing by 1.000 mL gives 0.186 mmol/mL=0.186 mol/L=0.186 M. [HW1 Q3]
Checkpoint: Total Tris concentration is 0.186 M, not 0.200 M. [HW1 Q3]
Step 2 — Recover the initial Tris acid/base split
What we know: Henderson–Hasselbalch is pH=pKₐ+log(B/A) for Tris base B and protonated Tris acid A. [N-S1 §14]
Knowledge needed: If r=B/A, then A=C_total/(1+r) and B=rC_total/(1+r). [N-S1 §14]
Reasoning—why this step: A pH and total concentration do not directly give the proton-change response; the initial acid and base reservoirs must be known separately. [N-S1 §14]
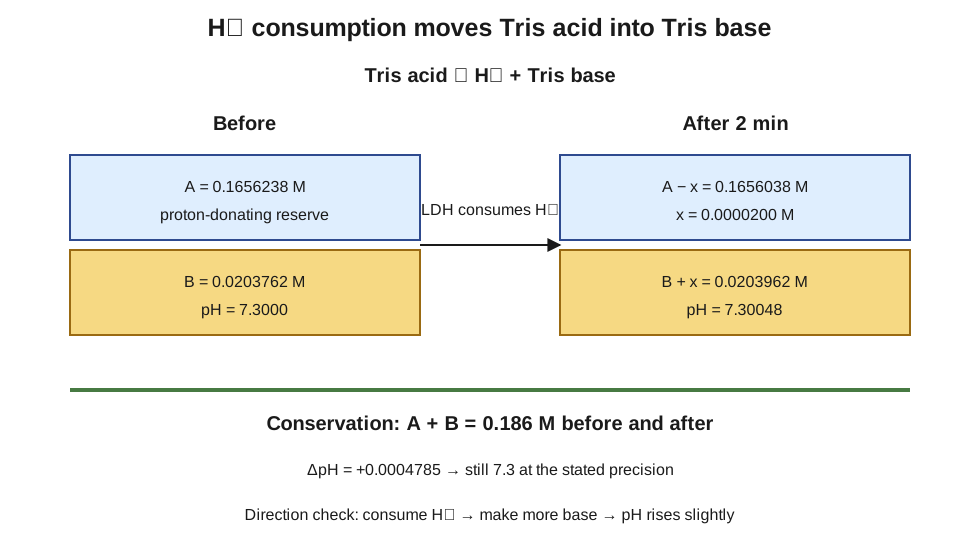
Work: r=10^(7.30−8.21)=10^(−0.91)=0.1230269. Then A=0.186/(1+0.1230269)=0.1656238 M and B=0.186−0.1656238=0.0203762 M. Substitution confirms 8.21+log(0.0203762/0.1656238)=7.3000. [N-S1 §14]
Checkpoint: The initial solution contains much more acid form than base form, consistent with pH below pKₐ. [N-S1 §14]
Step 3 — Convert activity and time into proton concentration change
What we know: The assay catalyzes 0.0100 μmol/min for 2.00 min, and the written LDH reaction consumes one H⁺ per NADH. [KEY Q3c] [N-S1 §15]
Knowledge needed: Amount change equals rate×time, and concentration change equals amount/volume. [N-S1 §§15–16]
Reasoning—why this step: The buffer update requires x in the same concentration unit as A and B; μmol cannot be inserted directly into a molar ratio. [N-S1 §14]
Work: 0.0100 μmol/min×2.00 min=0.0200 μmol H⁺ consumed. In 1.00 mL, 0.0200 μmol/1.00 mL=0.0200 mmol/L=2.00×10⁻⁵ mol/L. Therefore x=0.0000200 M. [KEY Q3c] [N-S1 §15]
Checkpoint: The reaction perturbs only 0.0000200/0.186≈0.000108, about 0.0108% of the total Tris pool. [N-S1 §14]
Step 4 — Update both forms and calculate final pH
What we know: When the reaction consumes H⁺, Tris acid donates H⁺ and becomes Tris base, so A_after=A−x and B_after=B+x. [N-S1 §§14–15]
Knowledge needed: Both numerator and denominator must change by equal and opposite amounts to conserve total buffer. [N-S1 §14]
Reasoning—why this step: Updating only one form creates or destroys Tris and exaggerates or understates the pH response. [N-S1 §14]
Work: A_after=0.1656238−0.0000200=0.1656038 M; B_after=0.0203762+0.0000200=0.0203962 M. Then pH_after=8.21+log(0.0203962/0.1656038)=7.3004785≈7.3005. Change: +0.0004785 pH unit. [N-S1 §§14–15]
Checkpoint: Rounded to the input pH's one decimal place, both initial and final pH are 7.3. [KEY Q3d]
Final answer
The assay contains 0.186 M total Tris, initially 0.1656238 M acid and 0.0203762 M base. Two minutes of 0.0100 IU LDH consume 0.0200 μmol H⁺ = 2.00×10⁻⁵ M, giving pH_after=7.30048≈7.3005. The change is only +0.00048, so the pH remains 7.3 to the stated precision and did not change much. [KEY Q3d] [N-S1 §§14–15]
Why the answer makes sense
The reaction changes only about 0.0108% of a 0.186 M buffer pool, so a sub-thousandth pH shift is the expected scale. The sign is also correct: consuming H⁺ converts acid to base and raises pH slightly. [N-S1 §§14–15]
Common mistakes
- Treating the whole 1.00 mL as 200 mM Tris overlooks the two water-based 35 μL additions. [HW1 Q3]
- Inserting
0.0200 μmoldirectly into molar A/B values mixes incompatible units. [N-S1 §14] - Using
A+x, B−xwould model H⁺ production, not the H⁺-consuming LDH direction. [N-S1 §15] - The unofficial detailed-key PNG prints
7.305; that is not the independently calculated result, which is7.3005with a change of about0.00048. [UKEY-P5 Q3d] [N-S1 §§14–15]
9. Q3e: Limiting pH change
Problem
HW1 identifier and page: Q3e, page 2. [HW1 Q3e]
Plain-language restatement: If an assay did show an unacceptable pH shift, give three distinct ways to reduce it and explain why each works for this H⁺-consuming reaction. [HW1 Q3e]
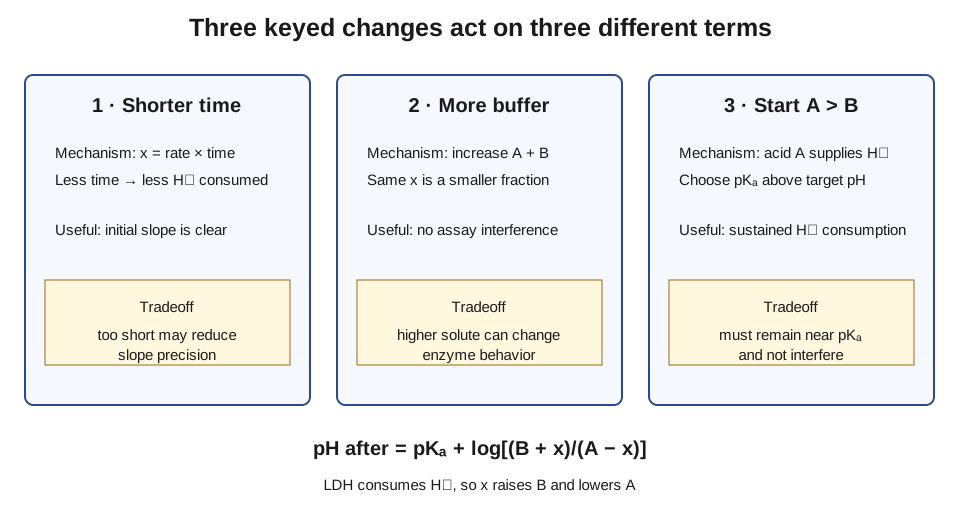
Given: The key names shorter assay time, higher buffer molarity, and a buffer/pKₐ choice with more acid than base initially. [KEY Q3e]
Find: Mechanism, useful condition, and tradeoff for each mitigation. [HW1 Q3e]
Required answer form: Three nonredundant interventions justified through the before/after buffer model. [KEY Q3e] [N-S1 §§14–15]
Solution roadmap
Reduce x by shortening the run; make the same x a smaller fraction of the buffer pool by increasing total buffer; increase the proton-donating acid reserve by choosing a pKₐ/starting ratio with A>B. The three keyed answers are therefore shorter time, higher buffer molarity, and more acid than base at time zero. [KEY Q3e] [N-S1 §§14–15]
Detailed A–Z walkthrough
Step 1 — Shorten the assay
What we know: At an approximately constant initial rate, proton equivalents accumulated are x=rate×time/volume. [KEY Q3c–e]
Knowledge needed: Reducing time reduces x directly while leaving the starting buffer unchanged. [N-S1 §14]
Reasoning—why this step: The smallest disturbance is produced by stopping while the trace is still long enough to estimate its initial slope but before much reaction accumulates. [N-S4 §19]
Work: If time is halved while initial rate and volume remain fixed, x is halved; the changes A−x and B+x are both halved. [N-S1 §§14–15]
Checkpoint: Useful when a clear initial slope can still be measured; tradeoff: too short a record may make the slope less precise. [N-S4 §19]
Step 2 — Increase buffer molarity
What we know: The same reaction x changes a smaller fraction of A and B when both starting concentrations are larger. [N-S1 §14]
Knowledge needed: Buffer capacity rises with the available conjugate-pair pool near the working pH. [N-S1 §14]
Reasoning—why this step: Raising total buffer reduces the fractional change in the A/B ratio that Henderson–Hasselbalch converts to a pH shift. [N-S1 §14]
Work: Compare (B+x)/(A−x) with (kB+x)/(kA−x) for k>1; the second ratio stays closer to its initial B/A. [N-S1 §14]
Checkpoint: Useful when buffer components do not interfere; tradeoff: higher solute concentration can itself affect the assay, so activity must be checked. [KEY Q3g]
Step 3 — Start with more acid form than base form
What we know: LDH consumes H⁺, so buffer acid A must donate H⁺ and becomes B. [N-S1 §15]
Knowledge needed: A pKₐ above the target pH gives B/A<1, hence A>B by Henderson–Hasselbalch. [N-S1 §14]
Reasoning—why this step: The abundant starting form should be the one consumed by the disturbance; for H⁺ consumption, that reserve is the acid form. [KEY Q3e] [N-S1 §15]
Work: Choose a compatible buffer whose pKₐ at the working conditions makes pH−pKₐ<0, so 10^(pH−pKₐ)=B/A<1. [N-S1 §14]
Checkpoint: Useful for sustained H⁺ consumption; tradeoff: moving too far from pKₐ weakens balanced buffering, and the buffer must not activate or inhibit LDH. [N-S1 §14] [KEY Q3g]
Final answer
The three keyed ways are: (1) run the assay for a shorter time, reducing total H⁺ consumed; (2) use a higher-molarity buffer, making that proton amount a smaller fraction of the buffer pool; and (3) choose a buffer/pKₐ that gives more acid A than base B initially, supplying the form consumed when LDH removes H⁺. Each change must still preserve a measurable initial slope and avoid buffer interference. [KEY Q3e] [N-S1 §§14–15] [KEY Q3g]
Why the answer makes sense
All three changes keep the after/before A/B ratio closer to its starting value but act on different variables: time changes x, molarity changes the size of A+B, and pKₐ changes the starting split. They are therefore genuinely distinct rather than three phrasings of one intervention. [N-S1 §14]
Common mistakes
- Listing “shorter time,” “less reaction,” and “less product” as three answers repeats one lever. [KEY Q3e]
- Choosing more base for an H⁺-consuming reaction puts the smaller reserve on the form that must donate H⁺. [N-S1 §15]
- Increasing buffer concentration without checking enzyme interference ignores the experimental decision rule in Q3g. [KEY Q3g]
10. Q3f: Prepare 200 mM Tris, pH 7.3
Problem
HW1 identifier and page: Q3f, page 2. [HW1 Q3f]
Plain-language restatement: Make 500 mL of 200 mM Tris at pH 7.3 from 1.0 M Tris stock at pH 9, 1.0 M HCl, optional 2.0 M NaOH, and water. [HW1 Q3f]
Given: Final volume 0.500 L, final total Tris 0.200 M, stock Tris 1.0 M at pH 9.0, Tris pKₐ 8.21, HCl 1.0 M. [HW1 Q3f] [N-S1 §14]
Find: Volumes of Tris stock, HCl, NaOH if needed, and water. [HW1 Q3f]
Required answer form: Fraction calculation, strong-acid equivalents, an explicit mixing recipe, and final concentration/volume audit. [KEY Q3f]
Solution roadmap
Require 0.100 mol total Tris, so take 100 mL of 1.0 M stock; calculate base fraction at pH 9.0 (0.86045) and pH 7.3 (0.10955); convert 0.75090×0.100 mol=0.07509 mol base to acid with about 75 mL 1.0 M HCl; add 325 mL water. Final recipe: 100 mL Tris stock + 75 mL HCl + 325 mL water; no NaOH. [KEY Q3f] [N-S1 §§14, 17]
Detailed A–Z walkthrough
Step 1 — Fix the total Tris amount
What we know: The final target is 0.500 L at 0.200 mol/L. [HW1 Q3f]
Knowledge needed: n=CV and V_stock=n/C_stock. [N-S1 §16]
Reasoning—why this step: Acid/base adjustment redistributes Tris forms but does not change total Tris, so the total amount must be set first. [N-S1 §§14, 17]
Work: n_total=(0.200 mol/L)(0.500 L)=0.100 mol=100 mmol. At 1.0 M, V=0.100 mol/(1.0 mol/L)=0.100 L=100 mL. [HW1 Q3f]
Checkpoint: Use exactly 100 mL of the Tris stock to obtain the required total concentration after dilution to 500 mL. [KEY Q3f]
Step 2 — Calculate the stock and target base fractions
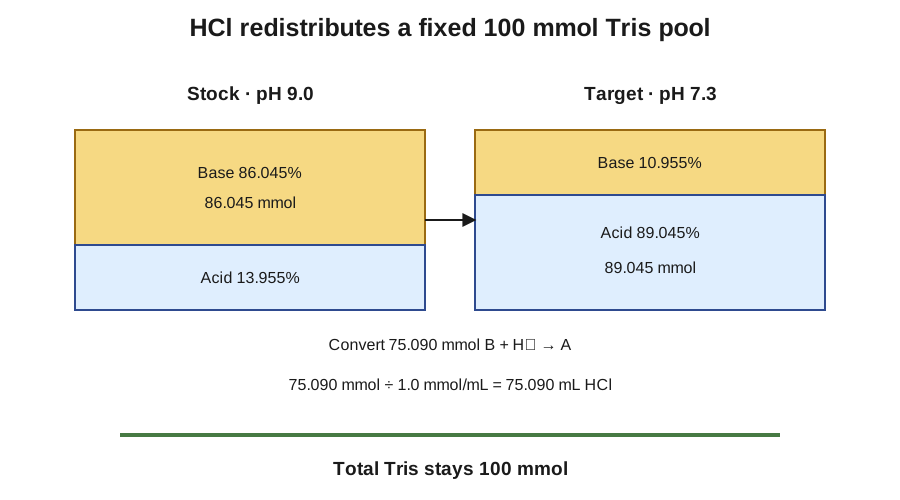
What we know: r=B/A=10^(pH−pKₐ) and base fraction is r/(1+r). [N-S1 §14]
Knowledge needed: The pH 9 stock is not 100% base; both its initial and target fractions matter. [HW1 Q3f]
Reasoning—why this step: Strong HCl must convert only the difference between starting and target base amounts. Treating the stock as pure base overestimates acid. [N-S1 §§14, 17]
Work: At pH 9: r=10^(9.00−8.21)=6.1660, so f_B=6.1660/7.1660=0.86045. At pH 7.3: r=10^(7.30−8.21)=0.1230269, so f_B=0.1230269/1.1230269=0.10955. [N-S1 §14]
Checkpoint: Base fraction must fall by 0.86045−0.10955=0.75090. [N-S1 §14]
Step 3 — Convert the fraction change to HCl volume
What we know: One mole HCl protonates one mole Tris base to Tris acid. [N-S1 §17]
Knowledge needed: Strong-acid equivalents are calculated from the base moles converted, then divided by acid-stock molarity. [N-S1 §17]
Reasoning—why this step: Henderson–Hasselbalch supplies the target split; stoichiometry, not another equilibrium expression, supplies the strong-acid volume. [N-S1 §§14, 17]
Work: 0.75090×100 mmol=75.090 mmol HCl. With 1.0 mmol/mL HCl, V=75.090 mmol/(1.0 mmol/mL)=75.090 mL≈75 mL. [N-S1 §17]
Checkpoint: Acid is required, so the available NaOH is not used. [KEY Q3f]
Step 4 — Construct and audit the mixing recipe
What we know: Component volumes must total 500 mL. [HW1 Q3f]
Knowledge needed: Water volume is the remainder after stock and acid additions at the requested precision. [N-S1 §16]
Reasoning—why this step: “Add 500 mL water” would make the final volume exceed 500 mL and lower the Tris concentration. [N-S1 §16]
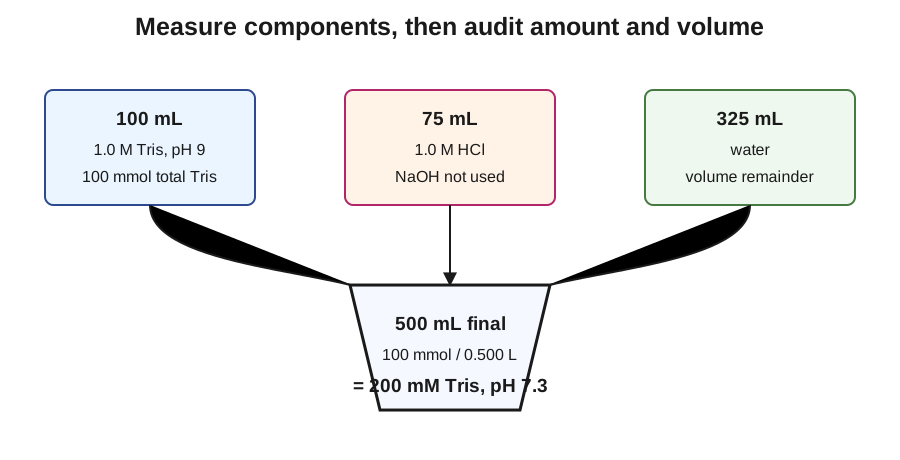
Work: Key-rounded recipe: 100 mL Tris + 75 mL HCl + (500−100−75)=325 mL water. Volume audit: 100+75+325=500 mL. Tris audit: 100 mL×1.0 mmol/mL=100 mmol; 100 mmol/500 mL=0.200 mmol/mL=200 mM. [KEY Q3f]
Checkpoint: Both final volume and total Tris concentration match the request. [KEY Q3f]
Final answer
Mix 100 mL of 1.0 M Tris at pH 9 + 75 mL of 1.0 M HCl + 325 mL water. Do not use NaOH. This gives 100 mmol Tris in 500 mL, or 200 mM Tris at pH 7.3 at the key's stated precision. [KEY Q3f]
Why the answer makes sense
The target pH is below both stock pH and Tris pKₐ, so acid—not base—must be added and acid form must dominate. The volume and concentration audits independently return 500 mL and 200 mM. [N-S1 §14] [KEY Q3f]
Common mistakes
- Assuming the pH 9 stock is 100% base ignores its 13.955% acid form. [N-S1 §14]
- Using 100 mL HCl would protonate all stock Tris rather than only the required fraction. [N-S1 §17]
- Adding 500 mL water instead of water to the final volume dilutes the buffer. [N-S1 §16]
- Using NaOH moves pH in the wrong direction from 9.0 to 7.3. [HW1 Q3f]
11. Q3g: Prepare phosphate and choose a buffer
Problem
HW1 identifier and page: Q3g, pages 2–3. [HW1 Q3g]
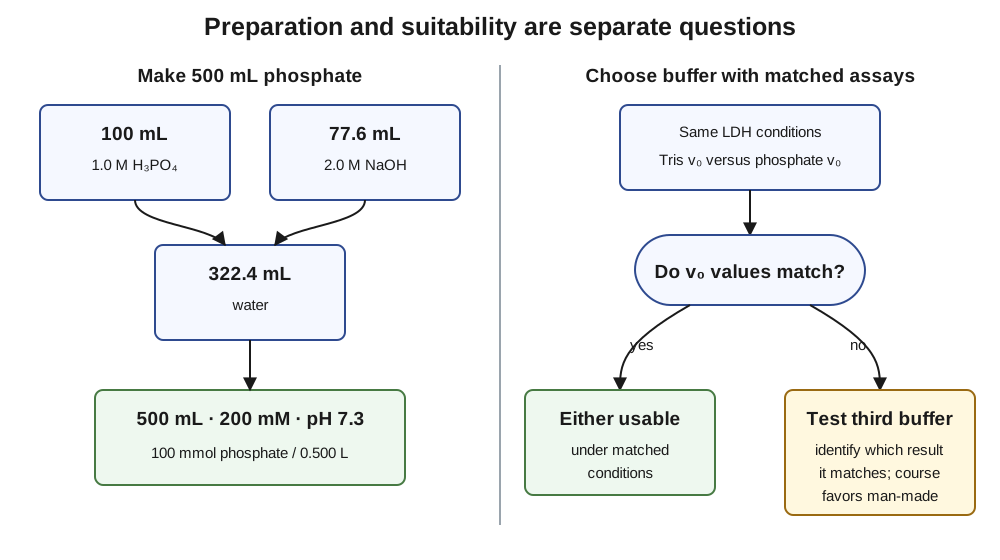
Plain-language restatement: Make 500 mL of 200 mM phosphate at pH 7.3 from 1.0 M H₃PO₄, 2.0 M NaOH, and water, then explain how matched LDH assays decide whether Tris or phosphate should be used. [HW1 Q3g]
Given: Phosphoric-acid pKₐ values are 2.12, 7.21, and 12.32; target pH is near pKₐ₂. [HW1 Q3g]
Find: Acid-stock, base-stock, and water volumes; relevant conjugate-pair fractions; and the experimental buffer-choice rule. [HW1 Q3g]
Required answer form: Equivalent-counting calculation, complete recipe with final-volume audit, and matched-assay decision tree. [KEY Q3g]
Solution roadmap
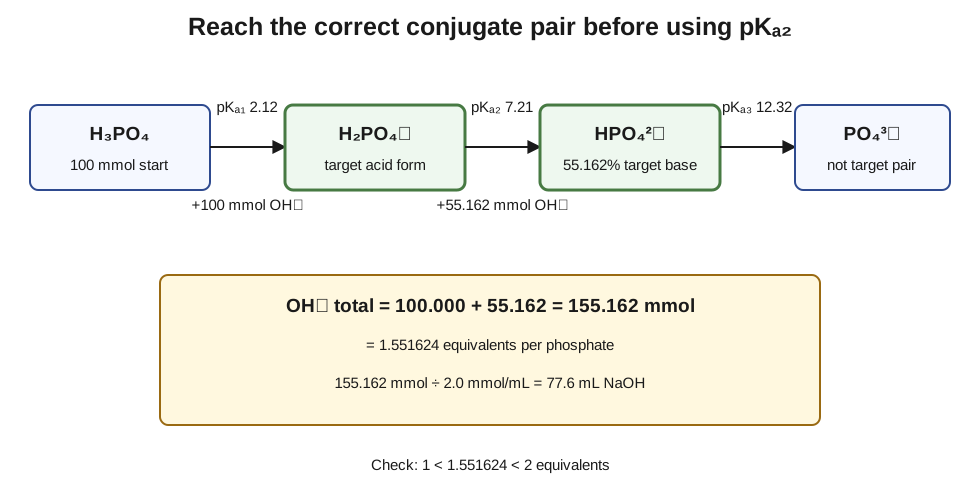
Take 0.100 mol H₃PO₄; spend one full 0.100 mol OH⁻ equivalent to reach H₂PO₄⁻; use pH−pKₐ₂=0.09 to find 55.162% HPO₄²⁻, requiring another 0.055162 mol OH⁻; total 0.155162 mol OH⁻/2.0 M=77.6 mL NaOH; add 322.4 mL water. Compare matched v₀ values in Tris and phosphate, using a third man-made buffer if they differ. [KEY Q3g] [N-S1 §16]
Detailed A–Z walkthrough
Step 1 — Calculate total phosphate and identify the active pair
What we know: 0.500 L×0.200 mol/L=0.100 mol total phosphate, so 100 mL of 1.0 M H₃PO₄ supplies it. [HW1 Q3g]
Knowledge needed: At pH 7.3, the relevant pair is H₂PO₄⁻/HPO₄²⁻ because pKₐ₂=7.21 is closest to the target. [HW1 Q3g] [N-S1 §16]
Reasoning—why this step: A polyprotic acid must be moved to the correct conjugate pair before Henderson–Hasselbalch is applied. [KEY p.1] [N-S1 §16]
Work: Draw H₃PO₄ → H₂PO₄⁻ → HPO₄²⁻ → PO₄³⁻ and label pKₐ values 2.12, 7.21, 12.32. Mark the middle pair as the target pair. [HW1 Q3g]
Checkpoint: The starting stock is one full deprotonation below the acid member needed near pH 7.3. [N-S1 §16]
Step 2 — Count the first full OH⁻ equivalent
What we know: Each H₃PO₄ must lose its first proton to become H₂PO₄⁻. [KEY p.1]
Knowledge needed: One mole OH⁻ neutralizes one mole of this proton, so 0.100 mol phosphate requires 0.100 mol OH⁻ before any pKₐ₂ fraction is formed. [N-S1 §16]
Reasoning—why this step: Applying pKₐ₂ directly to unneutralized H₃PO₄ omits 100 mmol of base and gives a physically wrong recipe. [KEY p.1]
Work: First-equivalent requirement: 0.100 mol H₃PO₄×1 mol OH⁻/mol phosphate=0.100 mol OH⁻. [N-S1 §16]
Checkpoint: The entire pool is now conceptually H₂PO₄⁻ before partial second neutralization. [N-S1 §16]
Step 3 — Calculate the partial second equivalent
What we know: HPO₄²⁻/H₂PO₄⁻=10^(7.30−7.21)=10^0.09. [N-S1 §§14, 16]
Knowledge needed: A ratio r converts to base fraction r/(1+r). [N-S1 §14]
Reasoning—why this step: Only the final HPO₄²⁻ fraction needs a second OH⁻ equivalent; H₂PO₄⁻ remains after the first. [N-S1 §16]
Work: r=1.230269; f_HPO4=r/(1+r)=0.551624. Extra OH⁻ is 0.551624×0.100 mol=0.0551624 mol. Total is 0.100+0.0551624=0.1551624 mol OH⁻. [N-S1 §§14, 16]
Checkpoint: Average neutralization is 1.551624 equivalents OH⁻ per phosphate, between the expected first and second endpoints. [N-S1 §16]
Step 4 — Convert NaOH amount to a complete recipe
What we know: NaOH stock is 2.0 mol/L and final volume is 500 mL. [HW1 Q3g]
Knowledge needed: V=n/C; water is whatever volume remains after acid and base stocks. [N-S1 §16]
Reasoning—why this step: The equivalent calculation determines chemistry; this conversion turns it into measurable laboratory volumes. [N-S1 §16]
Work: V_NaOH=0.1551624 mol/(2.0 mol/L)=0.0775812 L=77.6 mL. Water: 500−100−77.6=322.4 mL. Audit: 100 mmol phosphate/0.500 L=0.200 M. [KEY Q3g]
Checkpoint: Recipe matches the key: 100 mL acid stock, 77.6 mL base stock, water to 500 mL. [KEY Q3g]
Step 5 — Decide which buffer to use experimentally
What we know: The key requires otherwise matched LDH assays in Tris and phosphate and comparison of initial velocity. If they differ, a third man-made buffer helps identify which result it matches. [KEY Q3g]
Knowledge needed: A different v₀ could mean one buffer activates LDH or the other inhibits it; two conditions alone do not identify which. [KEY Q3g]
Reasoning—why this step: Buffer suitability is an empirical assay property, not something the preparation calculation can decide. [KEY Q3g]
Work: Keep enzyme, substrate, NADH, pH, temperature, ionic conditions, and timing matched while changing buffer identity. If v₀ agrees, either is usable. If not, assay a third man-made buffer; determine which original result it matches, with the course generally favoring the man-made buffer. [KEY Q3g]
Checkpoint: The decision rule distinguishes preparation correctness from possible buffer interference. [KEY Q3g]
Final answer
Mix 100 mL of 1.0 M H₃PO₄ + 77.6 mL of 2.0 M NaOH + 322.4 mL water to obtain 500 mL of 200 mM phosphate, pH 7.3. Compare otherwise matched LDH v₀ values in Tris and phosphate; if equal, either is acceptable, and if different, use a third man-made buffer to resolve likely activation/inhibition, generally favoring the man-made buffer in the course decision rule. [KEY Q3g]
Why the answer makes sense
The target pH is slightly above pKₐ₂, so HPO₄²⁻ should be slightly more abundant than H₂PO₄⁻; the calculated 55.16%/44.84% split has that direction. The required 1.5516 OH⁻ equivalents lies correctly between one equivalent (all H₂PO₄⁻) and two (all HPO₄²⁻). [N-S1 §§14, 16]
Common mistakes
- Omitting the first full equivalent gives only the partial pKₐ₂ neutralization and a severely low NaOH volume. [KEY p.1]
- Using the ratio 1.230269 as though it were a fraction gives more than 100% base. [N-S1 §14]
- Forgetting that stock volumes displace water makes more than 500 mL total. [N-S1 §16]
- Choosing a buffer from its name rather than matched LDH rates ignores the course interference test. [KEY Q3g]
12. Q3h: Why enzyme assays need buffers

Problem
HW1 identifier and page: Q3h, page 3. [HW1 Q3h]
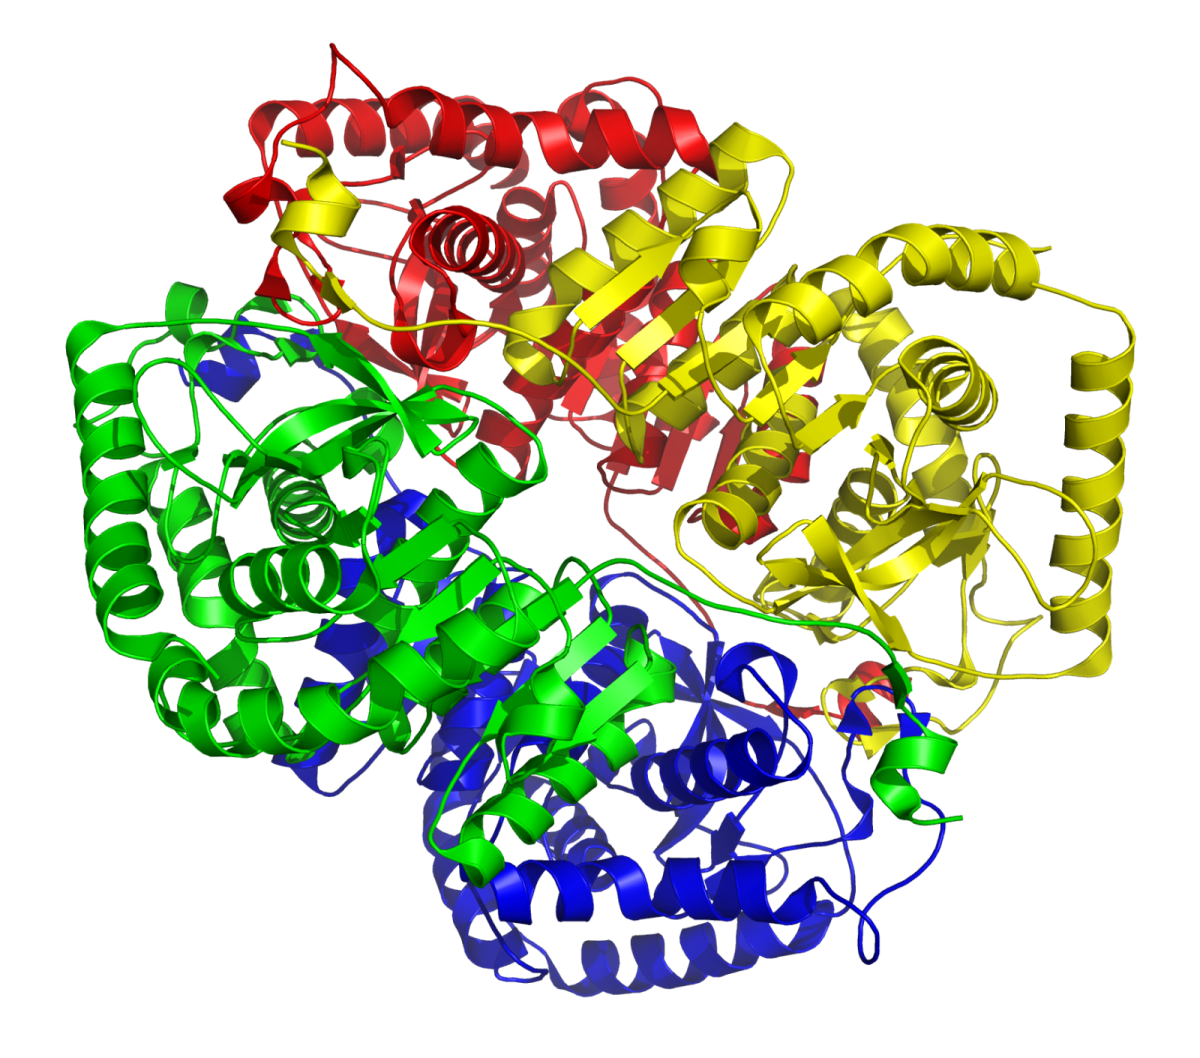
Plain-language restatement: Explain why an enzyme assay still requires controlled pH even when H⁺ is absent from the net reaction, including every course-supported effect on substrate binding and enzyme structure. [HW1 Q3h]
Given: pH changes protonation and charge patterns; the key identifies substrate charges/hydrogen bonds plus enzyme hydrogen bonds and ionic bonds as relevant. [KEY Q3h] [N-S1 §§6, 14]
Find: A mechanistic chain from pH to molecular interactions to binding, structure, and measured catalysis. [HW1 Q3h]
Required answer form: A complete paragraph with both the substrate-recognition arm and the enzyme-structure arm. [KEY Q3h]
Solution roadmap
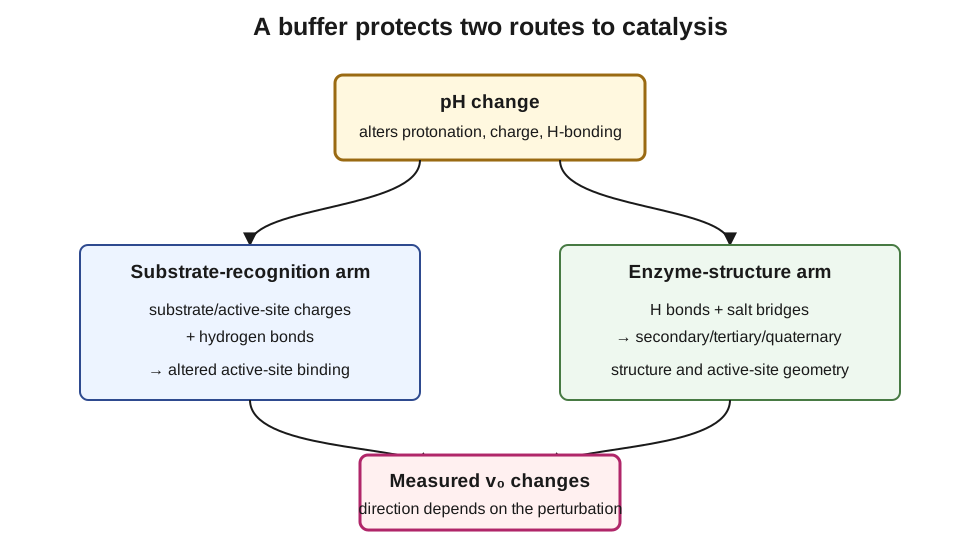
Connect pH to protonation/charge; connect charge to substrate hydrogen bonds and electrostatic recognition at the active site; connect the same pH sensitivity to enzyme hydrogen bonds and ionic bonds; map those interactions to secondary/tertiary/quaternary structure and active-site geometry; conclude that binding and catalytic rate can change even without net H⁺ stoichiometry. [KEY Q3h] [N-S1 §§6, 14]
Detailed A–Z walkthrough
Step 1 — Start with ionization, not the net equation
What we know: pH describes the proton environment and can change whether weak-acid/base groups are protonated, thereby changing their charge and hydrogen-bonding behavior. [N-S1 §§6, 14]
Knowledge needed: A net chemical equation lists consumed/produced species but not every protonation state required for molecular recognition or a stable protein conformation. [KEY Q3h]
Reasoning—why this step: The apparent puzzle disappears once pH is treated as a condition controlling molecular groups rather than only as a reaction stoichiometric term. [KEY Q3h] [N-S1 §14]
Work: Write the first link: pH change → protonation/charge change → altered hydrogen-bond donor/acceptor and ionic-interaction pattern. [N-S1 §§6, 14]
Checkpoint: There is now a mechanism for pH to matter without H⁺ appearing in the net assay equation. [KEY Q3h]
Step 2 — Follow the substrate-recognition arm
What we know: The key states that substrate charges and hydrogen bonds may be necessary for correct binding at the enzyme active site. [KEY Q3h]
Knowledge needed: Binding depends on complementary interaction patterns between substrate and active site. [N-S1 §6]
Reasoning—why this step: If pH changes a required charge or hydrogen-bonding group, the substrate may bind less effectively even though the substrate's net reaction formula contains no H⁺. [KEY Q3h]
Work: Extend the chain: ionization change → different substrate/active-site charges or H bonds → changed active-site binding → changed observed v₀. [KEY Q3h]
Checkpoint: One complete reason for buffering is now established at the recognition/binding level. [KEY Q3h]
Step 3 — Follow the enzyme-structure arm
What we know: The key states that hydrogen bonds support secondary, tertiary, and quaternary enzyme structure, while ionic bonds support tertiary and quaternary structure; both are pH-sensitive. [KEY Q3h]
Knowledge needed: Catalysis requires the active three-dimensional enzyme and correct active-site arrangement, not merely an intact peptide chain. [N-S1 §6]
Reasoning—why this step: Changing the interactions that stabilize folding or subunit assembly can distort the catalytic site even when substrate protonation is unaffected. [KEY Q3h]
Work: Extend the second chain: ionization change → altered hydrogen bonds/salt bridges → altered secondary/tertiary/quaternary structure → altered active-site geometry or assembly → changed v₀. [KEY Q3h]
Checkpoint: The explanation now contains both independent course-required arms: binding and enzyme organization. [KEY Q3h]
Step 4 — Compose the complete explanation
What we know: The prompt asks for all reasons, so neither the binding arm nor the structure arm is sufficient alone. [HW1 Q3h] [KEY Q3h]
Knowledge needed: A strong answer names the affected interactions, the molecular consequence, and the assay-level result. [KEY Q3h]
Reasoning—why this step: Combining the two causal chains demonstrates why buffer is required rather than merely asserting that enzymes “prefer” a pH. [KEY Q3h]
Work: State that controlled pH preserves substrate charges/H bonds needed for binding and preserves enzyme H bonds/ionic bonds needed for proper secondary, tertiary, and quaternary structure; loss of either changes the measured reaction rate. [KEY Q3h]
Checkpoint: The final paragraph answers the “even without H⁺” clause and includes every key-listed mechanism. [KEY Q3h]
Final answer
A buffer is needed because pH controls protonation, charge, and hydrogen-bonding patterns even when H⁺ is absent from the net reaction. Substrate charges and hydrogen bonds may be required for correct active-site binding. Enzyme hydrogen bonds help maintain secondary, tertiary, and quaternary structure, and ionic bonds help maintain tertiary and quaternary structure. A pH change can therefore alter binding, folding/subunit assembly, active-site geometry, and the measured v₀; the buffer holds those conditions stable. [KEY Q3h] [N-S1 §§6, 14]
Why the answer makes sense
The explanation predicts two experimentally distinct failure modes—loss of substrate recognition or loss of active enzyme structure—yet both reduce or alter the measured rate. That convergence explains why the written reaction alone is insufficient to decide whether pH control matters. [KEY Q3h]
Common mistakes
- Saying only “enzymes need the right pH” provides no molecular mechanism. [KEY Q3h]
- Giving only substrate binding or only protein structure omits half of the keyed answer. [KEY Q3h]
- Naming covalent peptide bonds as the pH-sensitive weak interactions misses the key's hydrogen-bond and ionic-bond focus. [KEY Q3h]
13. Q3i: Predict all four LDH gels

Problem
HW1 identifier and page: Q3i, page 3. [HW1 Q3i]
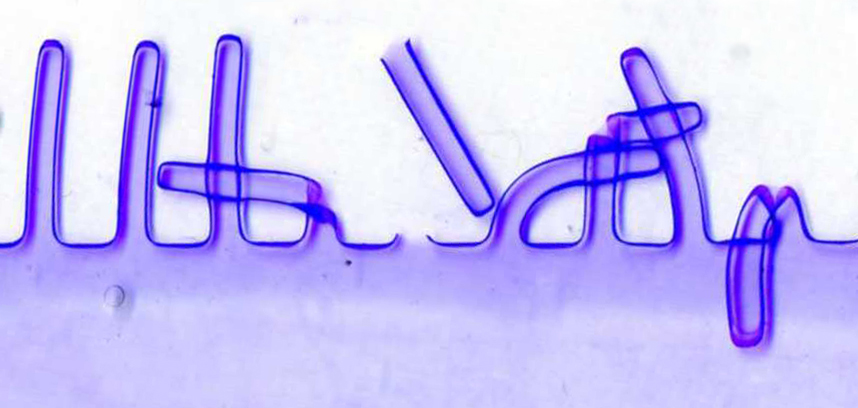
Plain-language restatement: Starting from all bovine LDH M/H tetramer combinations, predict IEF, native PAGE, SDS-PAGE, and two-dimensional IEF/SDS-PAGE patterns. Label every band/spot with identity and molecular mass and label all electrodes. [HW1 Q3i]
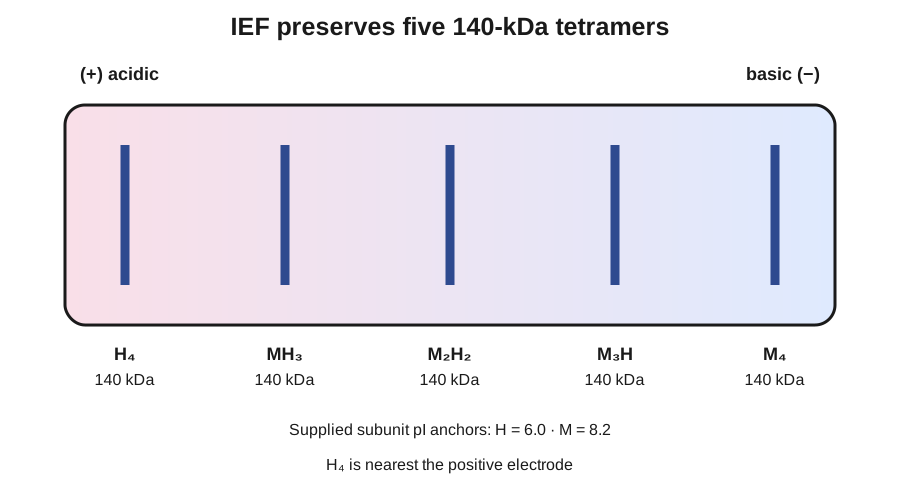
Given: Native LDH is 140,000 Da and contains four equal subunits. Isozymes range from M₄ to H₄; M-subunit pI is 8.2 and H-subunit pI is 6.0. [HW1 Q3i]
Find: Band/spot count, order, identity, molecular mass, and electrode orientation for four gel methods. [HW1 Q3i]
Required answer form: Four fully labeled diagrams plus a short method-by-method explanation. [KEY Q3i]
Solution roadmap
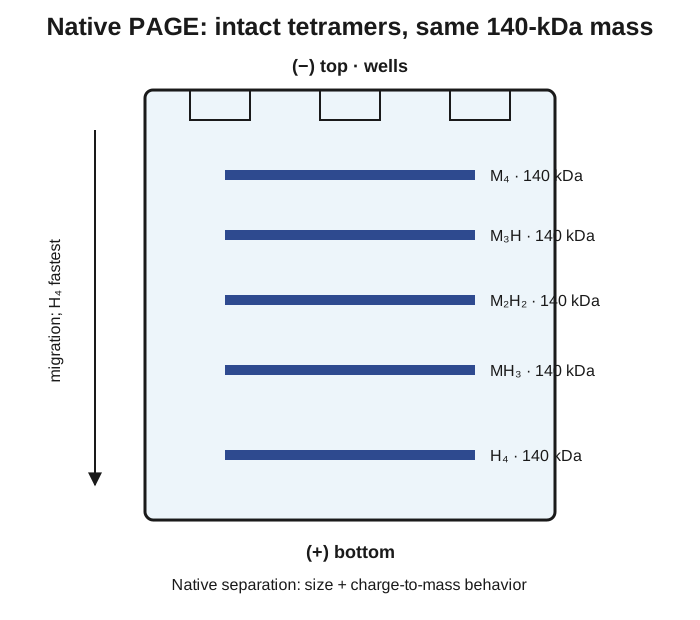
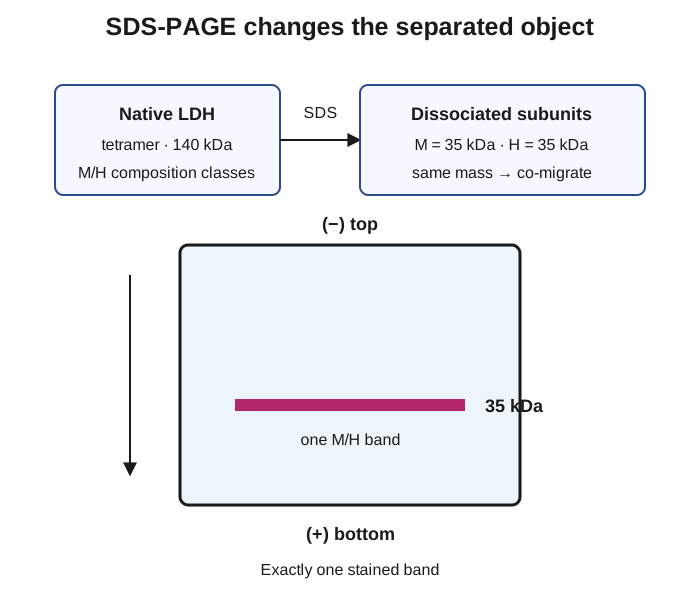
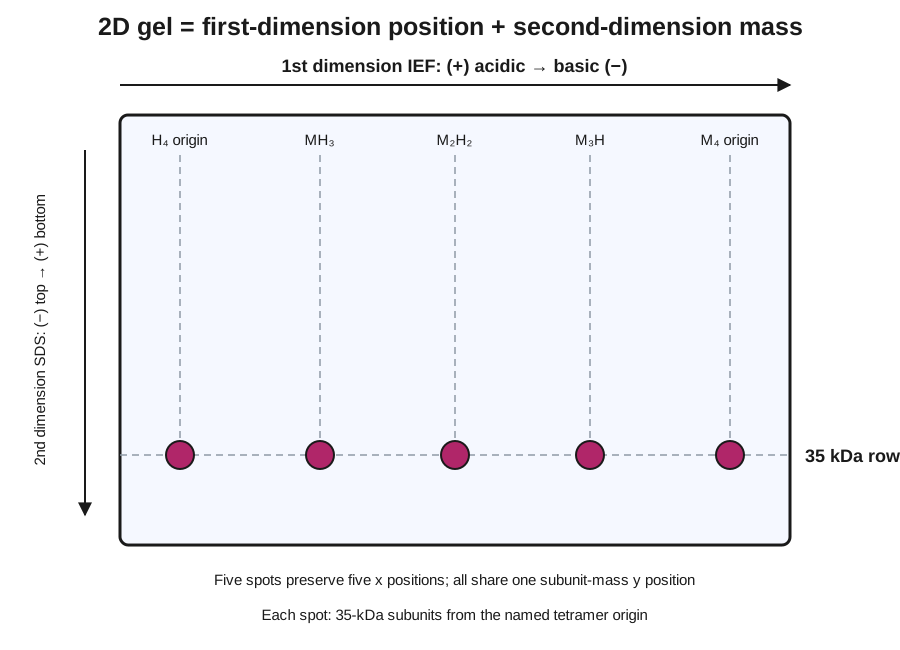
List five tetramers and calculate 35 kDa per subunit; keep five 140-kDa species for IEF and native PAGE; order IEF from H₄ nearest the positive/acidic end to M₄ nearest the negative/basic end; draw five native bands with H₄ fastest; collapse all denatured M/H subunits into one 35-kDa SDS band; carry the five first-dimension pI positions into five 35-kDa spots in 2D. [KEY Q3i] [N-S2 §§3–5, 19–22]
Detailed A–Z walkthrough
Step 1 — Establish compositions and masses
What we know: Four subunit positions filled by M or H give the composition classes M₄, M₃H, M₂H₂, MH₃, and H₄. Native mass is 140 kDa. [HW1 Q3i]
Knowledge needed: Equal subunit mass is 140 kDa/4=35 kDa; composition multiplicity does not create additional classes beyond the five counts of H subunits. [HW1 Q3i]
Reasoning—why this step: Every later prediction depends on whether the method separates intact 140-kDa tetramers or dissociated 35-kDa subunits. [N-S2 §§3–5]
Work: Write the intact list M₄, M₃H, M₂H₂, MH₃, H₄, each 140 kDa. Then calculate and circle subunit mass=35 kDa. [HW1 Q3i]
Checkpoint: There are five intact isozyme identities but only one subunit mass class. [KEY Q3i]
Step 2 — Solve IEF
What we know: IEF preserves the tetramers and separates by pI in a pH gradient; H subunits have lower pI than M subunits. The key places H₄ nearest the positive electrode. [HW1 Q3i] [KEY Q3i] [N-S2 §§3, 19]
Knowledge needed: Increasing H content shifts the intact isozyme toward the more acidic/lower-pI end; all intact species retain 140-kDa mass. [HW1 Q3i]
Reasoning—why this step: IEF ordering comes from composition-dependent pI, not mass, because the five tetramers have the same native molecular weight. [N-S2 §3]
Work: Label acidic/+ at one end and basic/− at the other. From +/acidic toward −/basic place H₄, MH₃, M₂H₂, M₃H, M₄; label every band 140 kDa. [KEY Q3i]
Checkpoint: Five 140-kDa bands appear, with H₄ closest to + as required by the key. [KEY Q3i]
Step 3 — Solve native PAGE
What we know: Native PAGE preserves quaternary structure and separates by size plus charge-to-mass behavior. The five LDH isozymes share 140-kDa mass; the key says H₄ migrates fastest. [KEY Q3i] [N-S2 §4]
Knowledge needed: With the same mass, composition-dependent native charge distinguishes the five bands; proteins migrate toward the positive electrode under the stated drawing convention. [N-S2 §4]
Reasoning—why this step: Reusing the IEF rule “separates only by pI” would be wrong, but the supplied/keyed H-rich migration order still controls the requested pattern. [KEY Q3i] [N-S2 §§3–4]
Work: Label negative/top and positive/bottom. Draw five 140-kDa bands with H₄ farthest/fastest, then MH₃, M₂H₂, M₃H, and M₄ progressively nearer the origin. [KEY Q3i]
Checkpoint: Native PAGE has five intact bands and H₄ is fastest; no 35-kDa band appears. [KEY Q3i]
Step 4 — Solve SDS-PAGE
What we know: SDS treatment denatures/dissociates LDH and gives subunits a similar charge-to-mass ratio; separation is by subunit size. M and H subunits are both 35 kDa. [HW1 Q3i] [N-S2 §§5, 20–21]
Knowledge needed: Species with the same subunit mass co-migrate even when their native tetramer compositions differed. [N-S2 §§5, 20–21]
Reasoning—why this step: Denaturation changes the object being separated from a 140-kDa isozyme to an individual 35-kDa polypeptide. [N-S2 §5]
Work: Label negative/top and positive/bottom. Draw one band at 35 kDa and label M and H co-migrate; do not draw separate 140-kDa isozyme bands. [KEY Q3i]
Checkpoint: SDS-PAGE yields exactly one 35-kDa band. [KEY Q3i]
Step 5 — Map IEF into the two-dimensional gel
What we know: In 2D IEF/SDS-PAGE, IEF supplies the horizontal pI positions; SDS-PAGE then moves denatured subunits vertically by size. [N-S2 §§19–22]
Knowledge needed: Each of the five first-dimension isozyme locations remains a distinct horizontal origin, even though all second-dimension subunits finish at 35 kDa. [KEY Q3i]
Reasoning—why this step: The second dimension dissociates the proteins but does not remix their first-dimension x coordinates. [N-S2 §22]
Work: Copy the IEF order across x: H₄, MH₃, M₂H₂, M₃H, M₄ from acidic/+ to basic/−. From each position, draw downward migration to the common 35-kDa row toward the positive second-dimension electrode. Label five spots by their tetramer origin and 35 kDa subunits. [KEY Q3i] [N-S2 §22]
Checkpoint: The 2D result has five horizontally separated spots on one molecular-mass row. [KEY Q3i]
Step 6 — Audit all identities, masses, and electrodes
What we know: The key outcomes are five 140-kDa IEF bands, five native bands with H₄ fastest, one 35-kDa SDS band, and five 35-kDa 2D spots. [KEY Q3i]
Knowledge needed: Each diagram must also label electrodes and distinguish intact tetramer identity from subunit mass. [HW1 Q3i]
Reasoning—why this step: A correct band count can still be incomplete if molecular weights or electrode directions are absent. [HW1 Q3i]
Work: IEF: 5 bands, 140 kDa, H₄ nearest +. Native: 5 bands, 140 kDa, H₄ fastest toward +. SDS: 1 band, 35 kDa, M/H co-migrate, + at bottom. 2D: 5 spots, 35 kDa row, x positions inherited from IEF, second-dimension + at bottom. [KEY Q3i]
Checkpoint: All four drawings satisfy band/spot count, identity, mass, and electrode requirements. [HW1 Q3i] [KEY Q3i]
Final answer
IEF: five 140-kDa bands ordered by H/M composition, with H₄ nearest the positive/acidic end. Native PAGE: five 140-kDa bands with H₄ migrating fastest toward the positive electrode. SDS-PAGE: one 35-kDa band because equal-mass M and H subunits co-migrate. 2D IEF/SDS-PAGE: five spots at the original IEF x positions, all on the 35-kDa row. The four diagrams above include the required identities, masses, and electrodes. [KEY Q3i]
Why the answer makes sense
Native methods preserve five composition classes, whereas SDS removes quaternary identity and reveals a single equal-mass subunit class. The 2D gel combines those facts: five first-dimension origins survive horizontally, but all material shares the same 35-kDa vertical destination. [N-S2 §§3–5, 19–22] [KEY Q3i]
Common mistakes
- Carrying 140 kDa into SDS-PAGE ignores tetramer dissociation. [N-S2 §5]
- Drawing two SDS bands for M and H ignores the prompt's equal subunit masses. [HW1 Q3i]
- Drawing one 2D spot loses the five distinct first-dimension positions. [N-S2 §22]
- Omitting electrodes leaves migration/order claims incomplete. [HW1 Q3i]
Compact equation and decision reference
| Task | Operation or decision |
|---|---|
| Percentage plateau | new=starting×(1±decimal fraction) [HW1 Q2] |
| Microcalorimetry CO₂-associated heat | Compare B−A within an ampule; require C≈A for validation. [N-S3 §§7–8] |
| Beer's Law | A=εLC; for rates, |ΔC|/min=(|ΔA|/min)/(εL). [N-S4 §17] |
| Enzyme activity | IU=μmol/min in the whole assay; convert M/min through assay liters. [N-S4 §20] |
| Henderson–Hasselbalch | pH=pKₐ+log(B/A); H⁺ consumed gives A−x, B+x. [N-S1 §§14–15] |
| Buffer fractions | If r=10^(pH−pKₐ), then f_B=r/(1+r) and f_A=1/(1+r). [N-S1 §14] |
| Polyprotic preparation | Pay every full neutralization equivalent needed to reach the target pair, then calculate the partial next equivalent. [N-S1 §16] |
| Gel decision | Ask: intact or dissociated? what variable separates? which electrode is the destination? [N-S2 §§3–5, 19–22] |
Sources and technical details
Source aliases and exact inputs
| Alias | Exact repository path |
|---|---|
| HW1 | homeworks/HW 1 Summer 2026.pdf |
| KEY | homeworks/Key HW 1 Summer 2026.pdf |
| UKEY-P5 | homeworks/hw-detailed/page5.png (unofficial Q3d print reference only) |
| MAP | docs/course-map.md |
| N-S1 | notes/course-intro-metabolism-overview-2026-08-03.md |
| N-S2 | notes/dna-microarrays-2d-gel-electrophoresis-2026-08-04.md |
| N-S3 | notes/microcalorimetry-and-glycolysis-intro-2026-08-05.md |
| N-S4 | notes/glycolysis-energetics-glycogen-2026-08-10.md |
| D2 | slides/Lecture 2 BIS 103 (key concepts from BIS 102).pdf |
| D3 | slides/Lecture 3 BIS 103 (DNA microarrays 2D IEF SDS-PAGE).pdf |
| D4 | slides/Lecture 4 BIS 103 (Microcalorimetry).pdf |
| D5 | slides/Lecture 5 (Key Concepts in Metabolism; glycolysis).pdf |
| D6 | slides/Lecture 6 (glycolysis cont.).pdf |
| D7 | slides/Lecture 7 (delta G, delta Keg, and Beer's Law).pdf |
Inputs manifest: homework: HW1; key: KEY; unofficial-print-reference: UKEY-P5; notes-used: N-S1, N-S2, N-S3, N-S4; slides-used: D2, D3, D4, D5, D6, D7; notes-unavailable: none; assigned-source-unavailable: Segel pp.92–93, 161–164, 332, and 352; excluded-inputs: deprecated/, site/, exam-prep and teaching documents.
Generated course-figure manifest
| Figure | Local path |
|---|---|
| Glycolysis carbon skeleton | static/assets/img/hw1/glycolysis-carbon-skeleton.svg |
| Glycolysis pathway and enzymes | static/assets/img/hw1/glycolysis-pathway-enzymes.svg |
| Glycolysis cofactor ledger | static/assets/img/hw1/glycolysis-cofactor-ledger.svg |
| Fermentation NAD regeneration | static/assets/img/hw1/fermentation-nad-regeneration.svg |
| Fatty-acid notation | static/assets/img/hw1/fatty-acid-notation.svg |
| Glycerol lipid assembly | static/assets/img/hw1/glycerol-lipid-assembly.svg |
| Microarray workflow | static/assets/img/hw1/microarray-workflow.svg |
| Microarray color reading | static/assets/img/hw1/microarray-color-reading.svg |
| Microcalorimetry ampule | static/assets/img/hw1/microcalorimetry-ampule.svg |
| Microcalorimetry causal logic | static/assets/img/hw1/microcalorimetry-causal-logic.svg |
| Microcalorimetry traces | static/assets/img/hw1/microcalorimetry-traces.svg |
| Enzyme kinetics curve | static/assets/img/hw1/enzyme-kinetics-curve.svg |
| NADH absorbance trace | static/assets/img/hw1/nadh-absorbance-trace.svg |
| Beer's Law relationship | static/assets/img/hw1/beers-law-relationship.svg |
| IU unit chain | static/assets/img/hw1/iu-unit-chain.svg |
| Buffer state change | static/assets/img/hw1/buffer-state-change.svg |
| Buffer capacity levers | static/assets/img/hw1/buffer-capacity-levers.svg |
| Tris fraction map | static/assets/img/hw1/tris-fraction-map.svg |
| Tris mixing recipe | static/assets/img/hw1/tris-mixing-recipe.svg |
| Phosphate equivalent ladder | static/assets/img/hw1/phosphate-equivalent-ladder.svg |
| Phosphate mixing recipe | static/assets/img/hw1/phosphate-mixing-recipe.svg |
| Enzyme pH interactions | static/assets/img/hw1/enzyme-ph-interactions.svg |
| LDH IEF | static/assets/img/hw1/ldh-ief.svg |
| LDH native PAGE | static/assets/img/hw1/ldh-native-page.svg |
| LDH SDS-PAGE | static/assets/img/hw1/ldh-sds-page.svg |
| LDH 2D gel | static/assets/img/hw1/ldh-2d-gel.svg |
Presentation-layer contextual image licenses
These six downloaded images are contextual only and are not evidence for any answer. Credit-page URLs are retained as the only external links on the published page.
- S. cerevisiae phase-contrast microscopy — Pilarbini — CC BY 4.0 —
https://commons.wikimedia.org/wiki/File:Saccharomyces_cerevisiae_100x_phase-contrast_microscopy.jpg. - DNA-microarray analysis — Bill Branson / National Cancer Institute — public domain —
https://commons.wikimedia.org/wiki/File:DNA-microarray_analysis.jpg. - Isolated spinach chloroplasts — SeemaaSaleh — CC BY-SA 4.0 —
https://commons.wikimedia.org/wiki/File:Chloroplast.jpeg. - Cuvette in a spectrophotometer — Ittarusp — CC BY-SA 4.0 —
https://commons.wikimedia.org/wiki/File:A_cuvette_in_a_spectrophotometer.jpg. - LDH M₄ ribbon structure — Fvasconcellos — public domain —
https://commons.wikimedia.org/wiki/File:Lactate_dehydrogenase_M4_%28muscle%29_1I10.png. - Protein gel electrophoresis — optimal tweezers — CC BY 2.0 —
https://commons.wikimedia.org/wiki/File:Protein_Gel_Electrophoresis_-_Wells_disarray_at_the_top.jpg.
Build notes
- The document uses only the source aliases above for course content and answer evidence.
- The assigned Segel pages are unavailable. The symbolic thermodynamics pattern is supported by N-S4 and is not a reconstruction of those missing exercises.
- UKEY-P5 is cited only to report that the unofficial image prints
7.305; the independently worked Q3d result remains7.3005. - Course figures are original SVG layouts generated from the figure specifications in this document; no homework or slide artwork is copied or traced.
- The published page is self-contained: no scripts, hotlinked images, remote fonts, forms, or runtime requests.
- Exact answers remain visible in ordinary browsing and print; only this technical/source disclosure is collapsed.
- Input content hashes are script-owned and recorded outside this document; see
docs/provenance.json.