Archived reference: This superseded HW1 teaching guide is preserved for reference and is not part of the active course pipeline.
Source Aliases
| Alias | Exact file |
|---|---|
| HW1 | homeworks/HW 1 Summer 2026.pdf |
| Key HW1 | homeworks/Key HW 1 Summer 2026.pdf |
| syllabus | syllabus/2026 Summer BIS 103.pdf |
| slides: Lecture 2 | slides/Lecture 2 BIS 103 (key concepts from BIS 102).pdf |
| slides: Lecture 3 | slides/Lecture 3 BIS 103 (DNA microarrays 2D IEF SDS-PAGE).pdf |
| slides: Lecture 4 | slides/Lecture 4 BIS 103 (Microcalorimetry).pdf |
| slides: Lecture 5 | slides/Lecture 5 (Key Concepts in Metabolism; glycolysis).pdf |
| slides: Lecture 6 | slides/Lecture 6 (glycolysis cont.).pdf |
| slides: Lecture 7 | slides/Lecture 7 (delta G, delta Keg, and Beer's Law).pdf |
| N-S1 | notes/course-intro-metabolism-overview-2026-08-03.md |
| N-S2 | notes/dna-microarrays-2d-gel-electrophoresis-2026-08-04.md |
| N-S3 | notes/microcalorimetry-and-glycolysis-intro-2026-08-05.md |
| N-S4 | notes/glycolysis-energetics-glycogen-2026-08-10.md |
Body text cites the note files by full path; the N-S1–N-S4 aliases are
used only in the Figure Index table below.
Inputs Manifest
homework:homeworks/HW 1 Summer 2026.pdfkey:homeworks/Key HW 1 Summer 2026.pdfnotes-used:notes/course-intro-metabolism-overview-2026-08-03.md— Source transcript:transcripts/en-BIS-103_ 2026-08-03 12_07.txtnotes/dna-microarrays-2d-gel-electrophoresis-2026-08-04.md— Source transcript:transcripts/en-BIS-103_ 2026-08-04 12_07.txtnotes/microcalorimetry-and-glycolysis-intro-2026-08-05.md— Source transcript:transcripts/en-BIS-103_ 2026-08-05 12_07.txtnotes/glycolysis-energetics-glycogen-2026-08-10.md— Source transcript:transcripts/en-BIS-103_ 2026-08-10 12_07.txt
notes-unavailable:none — every MT1-range session has a current-contract noteslides-used:decks 2–7 (Lecture 2throughLecture 7, exact paths in the Source Aliases table)
Figure Index
| Figure id | File | Derived from | Module |
|---|---|---|---|
| buffer-capacity | notes/teaching/figures/hw1-buffer-capacity.svg |
N-S1 §14 | #primer-buffers |
| beers-law | notes/teaching/figures/hw1-beers-law.svg |
slides: Lecture 7 p.3 | #primer-beers-law |
| nad-structure | notes/teaching/figures/hw1-nad-structure.svg |
slides: Lecture 6 p.3; N-S4 §12 | #primer-nadh |
| nadh-spectra | notes/teaching/figures/hw1-nadh-spectra.svg |
slides: Lecture 6 p.3; N-S4 §12 | #primer-nadh |
| michaelis-menten | notes/teaching/figures/hw1-michaelis-menten.svg |
N-S1 §18 (lecturer drawing) | #primer-kinetics |
| glucose | notes/teaching/figures/hw1-glucose.svg |
slides: Lecture 5 p.6; N-S3 §22 | #directive-glycolysis |
| glycolysis | notes/teaching/figures/hw1-glycolysis.svg |
slides: Lecture 6 p.2; N-S3 §21–§29 | #directive-glycolysis |
| fatty-acids | notes/teaching/figures/hw1-fatty-acids.svg |
N-S2 §6; slides: Lecture 2 | #directive-lipids |
| triglyceride | notes/teaching/figures/hw1-triglyceride.svg |
N-S2 §7 | #directive-lipids |
| phospholipid-pc | notes/teaching/figures/hw1-phospholipid-pc.svg |
N-S2 §8 | #directive-lipids |
| phospholipid-ps | notes/teaching/figures/hw1-phospholipid-ps.svg |
N-S2 §8 | #directive-lipids |
| microarray-workflow | notes/teaching/figures/hw1-microarray-workflow.svg |
slides: Lecture 3 pp.3–5; N-S2 §9–§16 | #q1 |
| microarray-spots | notes/teaching/figures/hw1-microarray-spots.svg |
slides: Lecture 3 pp.5–6; N-S2 §16 | #q1 |
| ampule | notes/teaching/figures/hw1-ampule.svg |
slides: Lecture 4 p.3; N-S3 §4–§5 | #q2 |
| heat-plot-control | notes/teaching/figures/hw1-heat-plot-control.svg |
slides: Lecture 4 pp.4–6; Key HW1 p.2 | #q2 |
| heat-plot-pesticide | notes/teaching/figures/hw1-heat-plot-pesticide.svg |
slides: Lecture 4 pp.4–6; Key HW1 p.2 | #q2 |
| a340-vs-time | notes/teaching/figures/hw1-a340-vs-time.svg |
slides: Lecture 7 p.4; N-S4 §19 | #q3a |
| tris-equilibrium | notes/teaching/figures/hw1-tris-equilibrium.svg |
N-S1 §17 | #q3d |
| phosphate-species | notes/teaching/figures/hw1-phosphate-species.svg |
slides: Lecture 2 p.4; N-S1 §16 | #q3g |
| phosphate-titration | notes/teaching/figures/hw1-phosphate-titration.svg |
slides: Lecture 2 p.4; N-S1 §16 | #q3g |
| protein-bonds | notes/teaching/figures/hw1-protein-bonds.svg |
N-S1 §6, §14; Key HW1 p.3 | #q3h |
| ief-gel | notes/teaching/figures/hw1-ief-gel.svg |
slides: Lecture 3 p.8; Key HW1 p.3 | #q3i |
| native-page | notes/teaching/figures/hw1-native-page.svg |
slides: Lecture 3 p.10; Key HW1 p.3 | #q3i |
| sds-page | notes/teaching/figures/hw1-sds-page.svg |
slides: Lecture 3 p.10; Key HW1 p.3 | #q3i |
| 2d-gel | notes/teaching/figures/hw1-2d-gel.svg |
slides: Lecture 3 p.11; Key HW1 p.3 | #q3i |
| delta-g-keq | notes/teaching/figures/hw1-delta-g-keq.svg |
slides: Lecture 7 p.2; N-S4 §15 | #skill-keq-dg |
Contents
- Part I — Shared Primer
- Part II — Directive Topics
- Part III — Problem-by-Problem Worked Solutions
- Q1 — DNA Microarray Lab Exercise
- Q2 — Microcalorimetry Experiment
- Q3a — Enzyme Kinetic Graph Axes
- Q3b — Interpreting the Negative ΔA₃₄₀
- Q3c — Calculating International Units of LDH
- Q3d — Did the pH Change During the Assay?
- Q3e — Three Ways to Minimize pH Change
- Q3f — Preparing 500 mL of 200 mM Tris Buffer at pH 7.3
- Q3g — Phosphate Buffer Preparation and Buffer Choice
- Q3h — Why Enzyme Assays Need a Buffer
- Q3i — LDH Isozymes on Four Kinds of Gel
- Part IV — Skill Drills
- Source Provenance
Part I — Shared Primer
These four sections teach the prerequisite concepts that appear in three or more problem modules later in the document. Each section covers just enough to follow the worked solutions; the full lecture treatment lives in the cross-referenced note sections.
A. Buffer Chemistry and the Henderson-Hasselbalch Equation
A buffer is a solution that resists changes in pH when small amounts of acid or base are added. It works because it contains a conjugate acid-base pair — two forms of the same compound that can swap a proton back and forth (notes/course-intro-metabolism-overview-2026-08-03.md §14).
Every acid has a characteristic pKa, the pH at which exactly half the molecules are in the acid form (A) and half are in the base form (B). When protons are added to a buffered solution, base-form molecules absorb them and convert to acid form; when protons are removed, acid-form molecules release them and convert to base form. This tug-of-war keeps the pH nearly constant (notes/course-intro-metabolism-overview-2026-08-03.md §14).
The relationship between pH and the ratio of base to acid is given by the Henderson-Hasselbalch equation (notes/course-intro-metabolism-overview-2026-08-03.md §14):
pH = pKa + log([B] / [A])
where [B] is the concentration of the base (deprotonated) form and [A] is the concentration of the acid (protonated) form.
Three consequences follow directly from this equation:
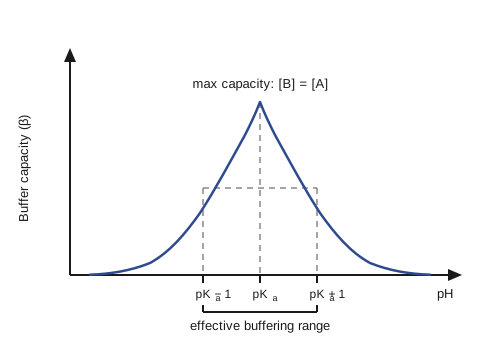
At pH = pKa, [B] = [A]. The log term is zero because log(1) = 0. Half the buffer molecules are in each form, so the solution has the maximum capacity to absorb protons (by converting B to A) or release them (by converting A to B) (notes/course-intro-metabolism-overview-2026-08-03.md §14).
When pH is well above the pKa, most of the compound is in the base form (notes/course-intro-metabolism-overview-2026-08-03.md §14).
When pH is well below the pKa, most is in the acid form.
Buffer capacity — the amount of acid or base a buffer can absorb before the pH shifts appreciably — is greatest when pH equals pKa and falls off on both sides. The practical effective buffering range extends roughly one pH unit above and below the pKa (notes/course-intro-metabolism-overview-2026-08-03.md §14).
An effective buffer also requires high molarity — a handful of molecules cannot stabilize pH for an entire solution — and must be non-interfering, meaning it should not activate or inhibit the enzyme being studied (notes/course-intro-metabolism-overview-2026-08-03.md §14).
Worked micro-example. The LDH assay in Q3 uses 200 mM Tris buffer at pH 7.3 with a pKa of 8.21. What fraction is in each form?
Apply Henderson-Hasselbalch:
7.3 = 8.21 + log([B]/[A])
log([B]/[A]) = 7.3 - 8.21 = -0.91
[B]/[A] = 10^(-0.91) = 0.123
Since pH is well below the pKa, the acid form dominates: for every 1 part base there are about 8.1 parts acid (notes/course-intro-metabolism-overview-2026-08-03.md §14). This makes intuitive sense — at pH 7.3 the solution is more acidic than the pKa, so more of the buffer carries a proton.
Adding strong acid (e.g., HCl) converts B to A: the new [B] decreases and the new [A] increases by the number of moles of acid added. Adding strong base (e.g., NaOH) converts A to B: [A] decreases and [B] increases. Too much of either overwhelms the buffer (notes/course-intro-metabolism-overview-2026-08-03.md §14).
Full lecture coverage: notes/course-intro-metabolism-overview-2026-08-03.md §14, §16, §17.
B. Beer's Law and Spectrophotometry
A spectrophotometer shines light of a chosen wavelength through a solution in a cuvette and measures how much light comes out the other side. The ratio of the incoming light intensity (I₀) to the outgoing intensity (I) defines absorbance (notes/glycolysis-energetics-glycogen-2026-08-10.md §17):
A = log₁₀(I₀ / I)
Absorbance is unitless (notes/glycolysis-energetics-glycogen-2026-08-10.md §17).
The Beer-Lambert Law relates absorbance to the concentration of the absorbing species (notes/glycolysis-energetics-glycogen-2026-08-10.md §17):
A = epsilon x l x c
where:
- epsilon (the molar extinction coefficient) is a constant determined by the structure of the absorbing molecule, with units M⁻¹cm⁻¹ (notes/glycolysis-energetics-glycogen-2026-08-10.md §17).
- l is the path length of the cuvette — the distance the light travels through the solution — in cm. The standard cuvette path length is 1 cm (notes/glycolysis-energetics-glycogen-2026-08-10.md §17).
- c is the concentration of the absorbing species in M (moles per liter) (notes/glycolysis-energetics-glycogen-2026-08-10.md §17).
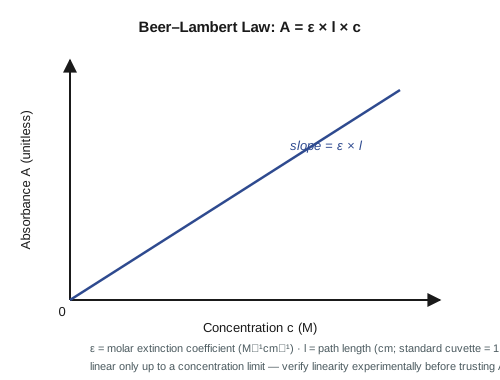
Because epsilon and l are constants for a given molecule and cuvette, Beer's Law is the equation of a straight line through the origin: a plot of A versus c produces a straight line whose slope equals epsilon x l (notes/glycolysis-energetics-glycogen-2026-08-10.md §17). This linearity is what makes spectrophotometry useful — if you know epsilon and measure A, you can calculate c.
Two important caveats:
- Linearity must be verified experimentally. At high concentrations the relationship curves off due to instrument limitations and intermolecular interactions. A practical check: dilute the sample in half and confirm that the absorbance drops by half (notes/glycolysis-energetics-glycogen-2026-08-10.md §17).
- Absorbance is proportional to concentration, not mass. The spectrophotometer does not integrate over volume; as long as the light beam passes through solution, the reading is the same regardless of how full the cuvette is (notes/glycolysis-energetics-glycogen-2026-08-10.md §17).
When the molecular weight of the absorbing species is unknown, an alternative form is used: A = a x l x c, where little a is the specific absorbance and c is in mg/mL. However, IU calculations (which require micromoles) cannot be done without knowing the molecular weight (notes/glycolysis-energetics-glycogen-2026-08-10.md §18).
Full lecture coverage: notes/glycolysis-energetics-glycogen-2026-08-10.md §17, §18.
C. NADH, NAD⁺, and the LDH Reaction
NAD⁺ (nicotinamide adenine dinucleotide, oxidized form) is a two-nucleotide coenzyme built from two halves joined by a pyrophosphate bridge (notes/glycolysis-energetics-glycogen-2026-08-10.md §12):
- The bottom half is adenosine monophosphate (AMP). It acts as a handle — it helps enzymes orient the molecule correctly in the active site. AMP handles also appear in coenzyme A, FAD, and other molecules (notes/glycolysis-energetics-glycogen-2026-08-10.md §12).
- The top half is the nicotinamide ring, which is the business end of the molecule. The ring carries an amide group (C=O bonded to NH₂ — an amide, not an amine) (notes/glycolysis-energetics-glycogen-2026-08-10.md §12).
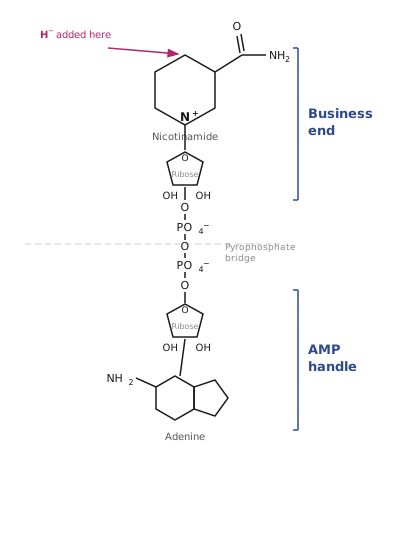
The nicotinamide ring of NAD⁺ carries a positive charge on the nitrogen, partially delocalized by resonance to the carbon at the top of the ring. This attracts a hydride (H⁻) — a hydrogen atom with two electrons — to that specific position and nowhere else on the molecule (notes/glycolysis-energetics-glycogen-2026-08-10.md §12; notes/course-intro-metabolism-overview-2026-08-03.md §15). When the hydride is added, NAD⁺ becomes NADH (the reduced form), and the positive charge on the nitrogen is eliminated (notes/glycolysis-energetics-glycogen-2026-08-10.md §12).
Three oxidation states of hydrogen are relevant here (notes/course-intro-metabolism-overview-2026-08-03.md §15):
- H⁺ (proton): no electrons.
- H· (hydrogen radical): one electron, no charge.
- H⁻ (hydride): two electrons, negative charge.
NADH is a safe energy carrier: it does not release its energy when it bumps into membranes, proteins, or DNA. Only an enzyme can unlock the energy at its active site (notes/course-intro-metabolism-overview-2026-08-03.md §15).
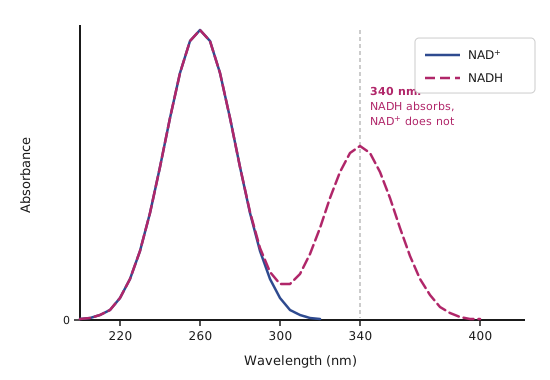
The critical spectral difference. NADH has an absorption peak at 340 nm; NAD⁺ does not absorb at 340 nm. Both absorb at 260 nm, but at that wavelength proteins and nucleic acids also absorb strongly, making it useless for measuring NADH specifically. At 340 nm, buffer, proteins, NAD⁺, and most substrates are transparent, so any change in A₃₄₀ equals a change in NADH concentration (notes/glycolysis-energetics-glycogen-2026-08-10.md §12).
The LDH reaction. Lactate dehydrogenase (LDH) catalyzes the last step of glycolysis (notes/course-intro-metabolism-overview-2026-08-03.md §15):
pyruvate + NADH + H⁺ --[LDH]--> L-lactate + NAD⁺
This reaction is reversible (notes/course-intro-metabolism-overview-2026-08-03.md §15). It has three substrates (pyruvate, NADH, H⁺) and two products (L-lactate, NAD⁺). Because NADH is consumed and converted to NAD⁺, the absorbance at 340 nm decreases over time when LDH is active (notes/glycolysis-energetics-glycogen-2026-08-10.md §19).
The key constant: epsilon for NADH at 340 nm = 6,220 M⁻¹cm⁻¹ (notes/glycolysis-energetics-glycogen-2026-08-10.md §20). This value connects Beer's Law to the LDH assay: from a measured change in A₃₄₀ over time, you can calculate how much NADH was consumed and therefore how much enzyme activity was present.
Full lecture coverage: notes/glycolysis-energetics-glycogen-2026-08-10.md §12; notes/course-intro-metabolism-overview-2026-08-03.md §15.
D. Enzyme Kinetics Fundamentals
An enzyme assay measures how much product an enzyme makes per unit time. The most common laboratory method is spectrophotometry — tracking an absorbance change over time (notes/course-intro-metabolism-overview-2026-08-03.md §9; notes/glycolysis-energetics-glycogen-2026-08-10.md §19).
When you run an assay, the raw data is a plot of absorbance versus time. If the enzyme is active, absorbance changes (increases or decreases depending on the reaction). The initial linear region of this curve — before substrate depletion or product inhibition curves the line — gives the initial velocity (v₀): the slope of the earliest, straight portion of the absorbance-vs-time trace (notes/glycolysis-energetics-glycogen-2026-08-10.md §19).
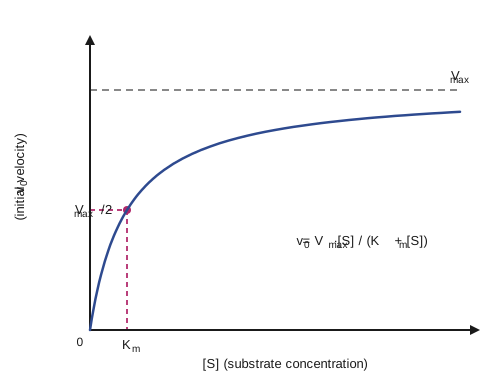
The Michaelis-Menten model describes how v₀ depends on substrate concentration [S] for most enzymes (notes/course-intro-metabolism-overview-2026-08-03.md §18):
v₀ = Vmax x [S] / (Km + [S])
This equation produces a hyperbolic curve when v₀ is plotted against [S] — the enzyme kinetic graph (notes/course-intro-metabolism-overview-2026-08-03.md §18):
- At zero substrate, velocity is zero.
- At low [S], velocity rises steeply — the enzyme is hungry for substrate.
- At very high [S], the enzyme is saturated and velocity plateaus at Vmax, the maximum velocity (notes/course-intro-metabolism-overview-2026-08-03.md §18).
Two parameters characterize the enzyme:
- Vmax — the maximum rate when the enzyme is fully saturated with substrate. It characterizes how fast the enzyme can go (notes/course-intro-metabolism-overview-2026-08-03.md §18).
- Km (the Michaelis constant) — the substrate concentration that gives exactly half of Vmax. It is a measure of how well the enzyme binds its substrate: a low Km means the enzyme reaches half-maximal speed at a low substrate concentration, indicating tight binding (notes/course-intro-metabolism-overview-2026-08-03.md §18).
Do not confuse two different graphs. The raw assay traces absorbance (e.g., A₃₄₀) on the y-axis versus time on the x-axis — this is the data from a single experiment at one substrate concentration. The enzyme kinetic graph plots v₀ on the y-axis versus [S] on the x-axis — this is built from multiple raw assays run at different substrate concentrations, extracting the initial slope from each one (notes/glycolysis-energetics-glycogen-2026-08-10.md §19).
An International Unit (IU) quantifies enzyme activity: 1 IU = 1 micromole of substrate converted per minute (notes/glycolysis-energetics-glycogen-2026-08-10.md §20). Converting a measured ΔA/time to IUs requires Beer's Law (see Primer B) and the epsilon of the absorbing species (see Primer C).
Full lecture coverage: notes/course-intro-metabolism-overview-2026-08-03.md §9, §18; notes/glycolysis-energetics-glycogen-2026-08-10.md §11, §19, §20.
Part II — Directive Topics
The homework lists several study directives — topics you are told to learn rather than questions with single answers (HW1 p.1). This part teaches each directive topic in full with worked examples and self-test questions.
Glycolysis and Alcoholic Fermentation
The homework asks you to learn the structures, enzyme names, cofactor and coenzyme requirements, and regulation of every step in glycolysis and alcoholic fermentation, and to know which reactions are reversible and which are irreversible (HW1 p.1). Page 3 of the homework provides a complete pathway diagram for reference (HW1 p.3). This section teaches each of those elements from scratch.
Why glycolysis matters
Glycolysis — literally "sugar-splitting" — is a sequence of ten enzyme-catalyzed reactions that breaks one molecule of glucose (a six-carbon sugar) into two molecules of pyruvate (a three-carbon compound) (notes/microcalorimetry-and-glycolysis-intro-2026-08-05.md §21). An enzyme is a protein that speeds up a specific chemical reaction without being consumed by it. The pathway takes place entirely in the cytosol, the fluid portion of the cell outside of organelles such as mitochondria (notes/microcalorimetry-and-glycolysis-intro-2026-08-05.md §21).
Glycolysis serves two purposes (notes/glycolysis-energetics-glycogen-2026-08-10.md §14):
- Produce ATP. ATP (adenosine triphosphate) is the cell's primary energy currency — a molecule whose breakdown releases energy that the cell can use to do work. Glycolysis yields a net of 2 ATP per glucose (notes/glycolysis-energetics-glycogen-2026-08-10.md §9).
- Provide biosynthetic intermediates. Several glycolytic intermediates can be diverted into other pathways to build molecules the cell needs. For example, 3-phosphoglycerate (3-PGA) can be converted to the amino acid serine (and from serine to glycine or cysteine), and dihydroxyacetone phosphate (DAP) can be converted to glycerol, the backbone of phospholipids and triacylglycerols (notes/glycolysis-energetics-glycogen-2026-08-10.md §14). In red blood cells, 1,3-bisphosphoglycerate (1,3-BPG) is diverted to make 2,3-BPG, a molecule that regulates hemoglobin function (notes/glycolysis-energetics-glycogen-2026-08-10.md §14).
Glycolysis is universal — nearly every living cell performs it — and was one of the first metabolic pathways ever discovered (notes/glycolysis-energetics-glycogen-2026-08-10.md §14).
The strategy
Before examining each step, it helps to see the cell's overall strategy for splitting glucose (notes/microcalorimetry-and-glycolysis-intro-2026-08-05.md §21):
- Phosphorylate carbon 6 of glucose, consuming one ATP (step 1).
- Rearrange the sugar so that carbon 1 can also accept a phosphate group (step 2).
- Phosphorylate carbon 1, consuming a second ATP (step 3).
- Split the six-carbon molecule down the middle to produce two three-carbon fragments, each carrying a phosphate group (steps 4 and 5).
- Harvest energy from each three-carbon fragment, generating ATP and reducing NAD⁺ to NADH (steps 6--10).
A few vocabulary notes for what follows:
- A phosphate group is a cluster of one phosphorus atom surrounded by oxygen atoms. At the pH inside a cell, phosphate groups carry negative charges (notes/microcalorimetry-and-glycolysis-intro-2026-08-05.md §24). When a phosphate group is transferred onto a molecule, the process is called phosphorylation.
- A kinase is an enzyme that transfers a phosphate group from one molecule to another (notes/glycolysis-energetics-glycogen-2026-08-10.md §3). A dehydrogenase is an enzyme that removes electrons (as a hydride ion, H⁻) from its substrate and passes them to an electron carrier such as NAD⁺ (notes/glycolysis-energetics-glycogen-2026-08-10.md §3). A mutase moves a chemical group from one position on a molecule to another position on the same molecule (notes/glycolysis-energetics-glycogen-2026-08-10.md §6).
- A cofactor is a small non-protein helper — often a metal ion — that an enzyme needs in order to function (notes/microcalorimetry-and-glycolysis-intro-2026-08-05.md §24). A coenzyme is a small organic molecule (not a metal) that must be present at the enzyme's active site for catalysis (notes/glycolysis-energetics-glycogen-2026-08-10.md §10).
- ATP consists of adenosine (a base plus a sugar) attached to three phosphate groups. When one terminal phosphate is transferred to a substrate, ATP becomes ADP (adenosine diphosphate). The energy released by that transfer powers many cellular reactions (notes/microcalorimetry-and-glycolysis-intro-2026-08-05.md §24).
- NAD⁺ (nicotinamide adenine dinucleotide) is a coenzyme that carries electrons. When it accepts a hydride from a substrate it becomes NADH. For a full description of NAD⁺/NADH structure and spectral properties, see Primer C.
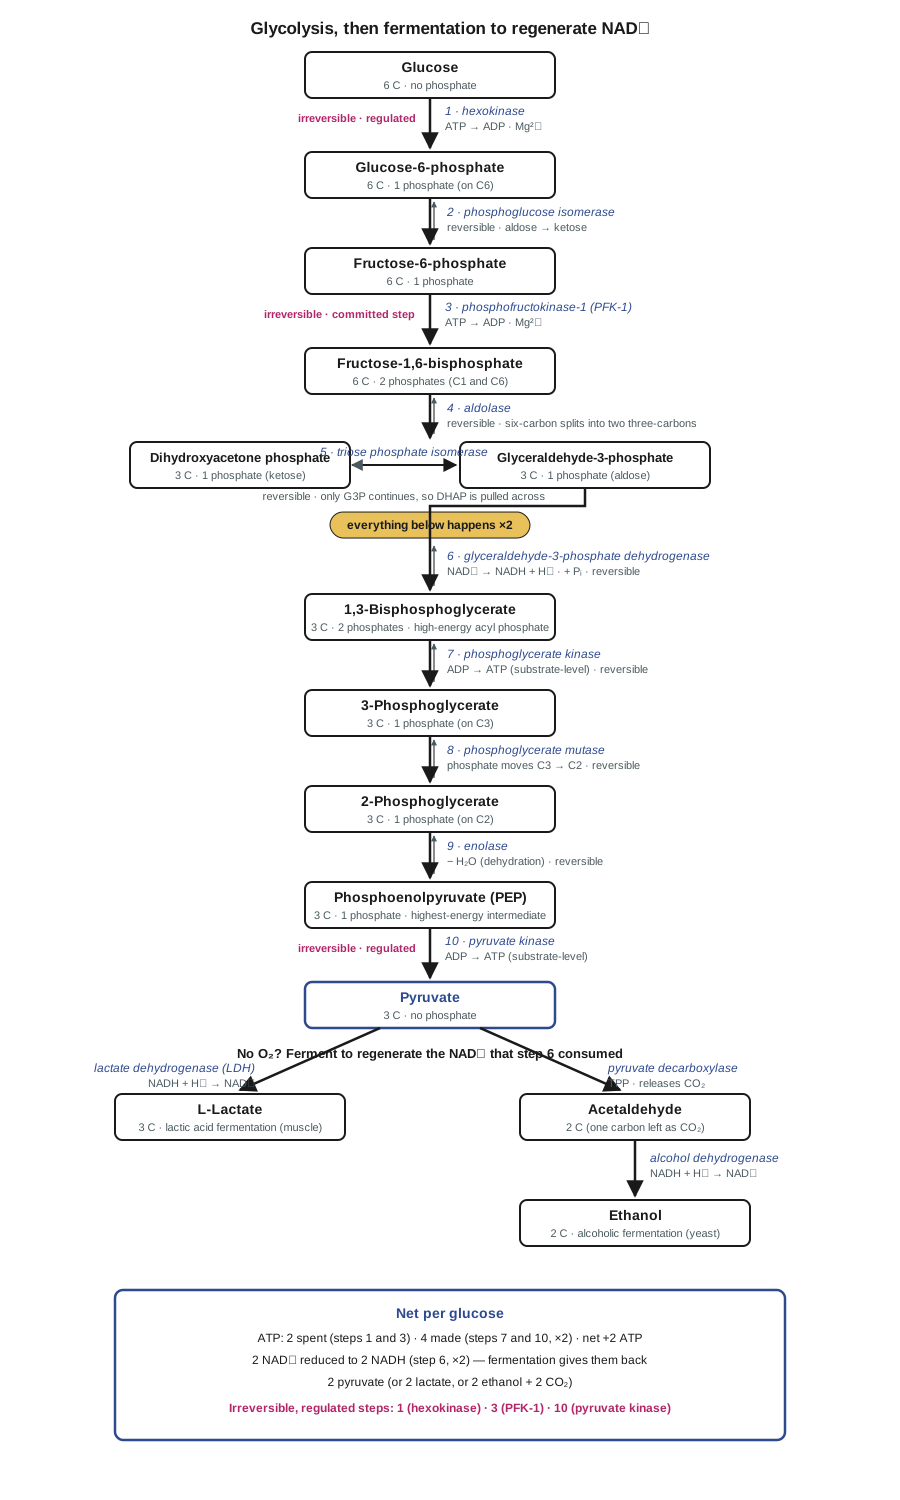
The pathway consumes 2 ATP molecules in its first half (the "investment phase," steps 1--3) and produces 4 ATP molecules in its second half (the "payoff phase," steps 7 and 10, each happening twice), for a net gain of 2 ATP (notes/glycolysis-energetics-glycogen-2026-08-10.md §5, §9).
Glucose: the starting substrate
Before glycolysis can begin, glucose must enter the cell. Glucose is a six-carbon sugar that is very polar because of its many oxygen-containing hydroxyl (OH) groups (notes/microcalorimetry-and-glycolysis-intro-2026-08-05.md §23). The interior of the cell membrane is nonpolar, so glucose cannot cross on its own. A membrane protein called the glucose transporter (molecular weight 45,000) facilitates its diffusion across the membrane (notes/microcalorimetry-and-glycolysis-intro-2026-08-05.md §23). Humans have 14 different glucose transporter genes (GLUT1 through GLUT14), reflecting the importance of glucose to tissues such as the brain, which runs mostly on glucose (notes/microcalorimetry-and-glycolysis-intro-2026-08-05.md §23).
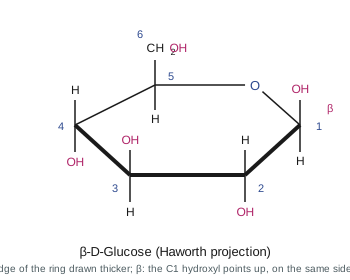
Inside the cell, glucose exists as a six-membered ring (the pyranose form). The most common form is beta-D-glucose, where the hydroxyl group on carbon 1 (the anomeric position) points above the plane of the ring (notes/microcalorimetry-and-glycolysis-intro-2026-08-05.md §22). In the shorthand used in lecture, vertical lines on the ring represent OH groups: the C2 OH points below the ring, the C3 OH above, and the C4 OH below (notes/microcalorimetry-and-glycolysis-intro-2026-08-05.md §22). Carbon 5 carries a CH₂OH group that extends above the ring (slides: Lecture 5 p.6). The bond between the ring oxygen and C1 is labile — the ring opens and closes in a process called mutarotation, allowing the C1 OH to flip between the beta (above) and alpha (below) positions (notes/microcalorimetry-and-glycolysis-intro-2026-08-05.md §22).
The ten steps of glycolysis
The following figure shows the complete pathway at a glance. Each step is then taught individually below it.
Step 1 — Hexokinase
glucose + ATP --[Hexokinase; Mg2+]--> glucose-6-phosphate (G6P) + ADP
- Enzyme: Hexokinase. The name indicates it can phosphorylate various hexose (six-carbon) sugars, not only glucose (notes/microcalorimetry-and-glycolysis-intro-2026-08-05.md §24).
- Cofactor: Mg²⁺ (magnesium ion). ATP carries several negative charges on its phosphate groups. The C6 hydroxyl of glucose acts as a nucleophile (an electron-rich atom that attacks an electron-poor center). Normally, the cloud of negative charges around ATP would repel the approaching OH. Mg²⁺ sits near the phosphates and shields those negative charges, allowing the C6 hydroxyl to approach and attack the phosphorus atom (notes/microcalorimetry-and-glycolysis-intro-2026-08-05.md §25). Without Mg²⁺, the reaction does not proceed (notes/microcalorimetry-and-glycolysis-intro-2026-08-05.md §25).
- Reversibility: Irreversible (one-way). Hexokinase is an allosteric enzyme that catalyzes a reaction with a large negative free-energy change (notes/glycolysis-energetics-glycogen-2026-08-10.md §13).
- Rationale: This single step accomplishes four things simultaneously (notes/microcalorimetry-and-glycolysis-intro-2026-08-05.md §24):
- Pulls the equilibrium — glucose is consumed (becoming G6P), which draws more glucose into the cell through the transporter.
- Traps glucose inside the cell — the glucose transporter does not recognize G6P, so the phosphorylated molecule cannot leave.
- Places a charged "handle" on C6 that helps the next enzyme grip and orient the substrate at its active site.
- Raises the energy content of the molecule by transferring some energy from ATP.
Hexokinase also undergoes a dramatic conformational change upon binding glucose: its two protein domains close like a clamshell around the substrate, physically excluding water from the active site (notes/microcalorimetry-and-glycolysis-intro-2026-08-05.md §26). This explains why the C6 hydroxyl of glucose attacks phosphorus 40,000 times faster than water does — water is simply not present in the active site when catalysis occurs (notes/microcalorimetry-and-glycolysis-intro-2026-08-05.md §26; slides: Lecture 5 p.7).
This step consumes the first of two ATP molecules that glycolysis "invests" before any energy is recovered (notes/microcalorimetry-and-glycolysis-intro-2026-08-05.md §24).
Step 2 — Phosphoglucose Isomerase (PGI)
glucose-6-phosphate (G6P) --[PGI]--> fructose-6-phosphate (F6P)
- Enzyme: Phosphoglucose isomerase (PGI) (notes/microcalorimetry-and-glycolysis-intro-2026-08-05.md §27).
- Cofactor: None (notes/microcalorimetry-and-glycolysis-intro-2026-08-05.md §27).
- Reversibility: Reversible (notes/microcalorimetry-and-glycolysis-intro-2026-08-05.md §27).
- Rationale: PGI converts an aldose (a sugar whose C1 carries an aldehyde group) into a ketose (a sugar whose C2 carries a ketone group) (notes/microcalorimetry-and-glycolysis-intro-2026-08-05.md §27). The purpose is chemical: the C1 aldehyde in G6P is electrophilic (electron-poor), so it cannot serve as the attacking nucleophile needed for the phosphorylation in the next step. By rearranging the sugar, PGI converts C1 to an alcohol (OH), which can act as a nucleophile and accept a phosphate group from ATP (notes/microcalorimetry-and-glycolysis-intro-2026-08-05.md §27).
Step 3 — Phosphofructokinase-1 (PFK1)
fructose-6-phosphate (F6P) + ATP --[PFK1]--> fructose-1,6-bisphosphate (F1,6BP) + ADP
- Enzyme: Phosphofructokinase-1 (PFK1). A second isomer, PFK2, exists and is covered later in the course (notes/microcalorimetry-and-glycolysis-intro-2026-08-05.md §28).
- Cofactor: None explicitly listed; ATP serves as the phosphate donor (notes/microcalorimetry-and-glycolysis-intro-2026-08-05.md §28; HW1 p.3).
- Reversibility: Irreversible (one-way) (notes/microcalorimetry-and-glycolysis-intro-2026-08-05.md §28).
- Rationale: A second ATP is consumed to phosphorylate C1, producing a sugar with phosphate groups on both ends — carbon 1 and carbon 6 (notes/microcalorimetry-and-glycolysis-intro-2026-08-05.md §28). PFK1 is allosteric and one of the most heavily regulated enzymes in glycolysis (see the regulation table below) (notes/glycolysis-energetics-glycogen-2026-08-10.md §13).
This step consumes the second and final ATP of the investment phase. At this point, the cell has spent 2 ATP and recovered none (notes/microcalorimetry-and-glycolysis-intro-2026-08-05.md §28).
Step 4 — Aldolase
fructose-1,6-bisphosphate (F1,6BP) --[Aldolase]--> dihydroxyacetone phosphate (DAP) + glyceraldehyde-3-phosphate (G3P)
- Enzyme: Aldolase (notes/microcalorimetry-and-glycolysis-intro-2026-08-05.md §29).
- Cofactor: None (notes/microcalorimetry-and-glycolysis-intro-2026-08-05.md §29).
- Reversibility: Reversible. In the reverse direction, aldolase catalyzes an aldol condensation that joins DAP and G3P back into F1,6BP (notes/glycolysis-energetics-glycogen-2026-08-10.md §1).
- Rationale: Aldolase splits F1,6BP between carbons 3 and 4, generating two three-carbon molecules, each carrying one phosphate group (notes/microcalorimetry-and-glycolysis-intro-2026-08-05.md §29). This is the literal "lysis" (splitting) event that gives glycolysis its name. One glucose molecule yields one DAP and one G3P (notes/glycolysis-energetics-glycogen-2026-08-10.md §1).
Step 5 — Triosephosphate Isomerase (TPI)
dihydroxyacetone phosphate (DAP) --[TPI]--> glyceraldehyde-3-phosphate (G3P)
- Enzyme: Triosephosphate isomerase (TPI) (notes/glycolysis-energetics-glycogen-2026-08-10.md §2).
- Cofactor: None (notes/glycolysis-energetics-glycogen-2026-08-10.md §2).
- Reversibility: Reversible (notes/glycolysis-energetics-glycogen-2026-08-10.md §2).
- Rationale: Only G3P can continue through the remaining steps of glycolysis — DAP cannot. TPI converts every DAP molecule into a second molecule of G3P, so one glucose effectively yields two molecules of G3P (notes/glycolysis-energetics-glycogen-2026-08-10.md §2). Without TPI, half the carbons from glucose would be lost (notes/glycolysis-energetics-glycogen-2026-08-10.md §2). TPI is one of the rare catalytically perfect enzymes: it cannot evolve to catalyze the reaction any faster because the only rate limitation is how quickly substrate diffuses into and product diffuses out of its active site (notes/glycolysis-energetics-glycogen-2026-08-10.md §2).
Critical point: From this step onward, every reaction happens twice per glucose — once for each G3P molecule (notes/glycolysis-energetics-glycogen-2026-08-10.md §2). All ATP and NADH yields in steps 6--10 must be doubled when tallying the net yield per glucose.
Step 6 — Glyceraldehyde-3-Phosphate Dehydrogenase (G3PDH)
G3P + Pi + NAD+ --[G3PDH]--> 1,3-bisphosphoglycerate (1,3-BPG) + NADH + H+
- Enzyme: Glyceraldehyde-3-phosphate dehydrogenase (G3PDH) (notes/glycolysis-energetics-glycogen-2026-08-10.md §3).
- Coenzyme: NAD⁺, which is reduced to NADH by accepting a hydride (H⁻) from G3P (notes/glycolysis-energetics-glycogen-2026-08-10.md §3). For background on NAD⁺/NADH structure and why NADH absorbs at 340 nm, see Primer C.
- Reversibility: Reversible (notes/glycolysis-energetics-glycogen-2026-08-10.md §3).
- Rationale: This reaction has three substrates and three products (notes/glycolysis-energetics-glycogen-2026-08-10.md §3). G3PDH oxidizes the aldehyde group of G3P while simultaneously attaching inorganic phosphate (Pi) to the product. The result is 1,3-BPG, which contains a high-energy acyl phosphate bond — a phosphate group attached to a carbonyl carbon (C=O) (notes/glycolysis-energetics-glycogen-2026-08-10.md §3). The energy stored in this bond (ΔG°′ of approximately −12 kcal/mol) is large enough to drive ATP synthesis in the next step (notes/glycolysis-energetics-glycogen-2026-08-10.md §3). ΔG°′ (standard free-energy change at pH 7) measures how much energy a reaction releases or requires when all reactants and products are at standard concentrations; a large negative value means the reaction is strongly energy-releasing. A full treatment of ΔG°′ appears in Part IV.
Why does the cell use Pi instead of water? If water attacked the aldehyde instead of Pi, the oxidation energy would simply dissipate as heat and entropy. By using Pi, the cell traps that energy in the acyl phosphate bond, making ATP synthesis possible in step 7 (notes/glycolysis-energetics-glycogen-2026-08-10.md §3).
The H⁺ released in this reaction comes from the OH group of inorganic phosphate at physiological pH (notes/glycolysis-energetics-glycogen-2026-08-10.md §3).
Step 7 — Phosphoglycerate Kinase
1,3-bisphosphoglycerate (1,3-BPG) + ADP --[Phosphoglycerate kinase; Mg2+]--> 3-phosphoglycerate (3-PGA) + ATP
- Enzyme: Phosphoglycerate kinase (notes/glycolysis-energetics-glycogen-2026-08-10.md §5).
- Cofactor: Mg²⁺ (slides: Lecture 6 p.2; HW1 p.3).
- Reversibility: Reversible — described as "totally reversible," with the actual direction determined by the concentrations of reactants and products in the cell (notes/glycolysis-energetics-glycogen-2026-08-10.md §5).
- Rationale: The high-energy acyl phosphate of 1,3-BPG is transferred to ADP, generating one molecule of ATP (notes/glycolysis-energetics-glycogen-2026-08-10.md §5). In 3-PGA, carbon 1 is the carboxyl group and the phosphate remains on carbon 3 (notes/glycolysis-energetics-glycogen-2026-08-10.md §5). Because this step happens twice per glucose, it produces 2 ATP — exactly replacing the 2 ATP consumed in steps 1 and 3. At this point, the net ATP balance is zero: the cell has broken even (notes/glycolysis-energetics-glycogen-2026-08-10.md §5).
Step 8 — Phosphoglycerate Mutase
3-phosphoglycerate (3-PGA) --[Phosphoglycerate mutase]--> 2-phosphoglycerate (2-PGA)
- Enzyme: Phosphoglycerate mutase (notes/glycolysis-energetics-glycogen-2026-08-10.md §6).
- Cofactor: None (notes/glycolysis-energetics-glycogen-2026-08-10.md §6).
- Reversibility: Reversible (notes/glycolysis-energetics-glycogen-2026-08-10.md §6).
- Rationale: The phosphate group is relocated from carbon 3 to carbon 2. 3-PGA and 2-PGA are structural isomers — same molecular formula, different arrangement (notes/glycolysis-energetics-glycogen-2026-08-10.md §6). The mechanism involves a "shell game": the enzyme's active site already contains its own phosphate before the substrate arrives. That pre-loaded phosphate is placed onto C2 first, and then the phosphate on C3 is removed and held by the enzyme for the next catalytic cycle. The phosphate on the product is therefore not the same atom that was on the substrate (notes/glycolysis-energetics-glycogen-2026-08-10.md §6).
Step 9 — Enolase
2-phosphoglycerate (2-PGA) --[Enolase]--> phosphoenolpyruvate (PEP) + H2O
- Enzyme: Enolase (notes/glycolysis-energetics-glycogen-2026-08-10.md §7).
- Cofactor: None (notes/glycolysis-energetics-glycogen-2026-08-10.md §7).
- Reversibility: Reversible (notes/glycolysis-energetics-glycogen-2026-08-10.md §7).
- Rationale: Enolase removes one water molecule from 2-PGA (a dehydration reaction), creating a carbon-carbon double bond between C2 and C3. The product, phosphoenolpyruvate (PEP), is a very high-energy compound with a ΔG°′ of −13.8 kcal/mol — more than enough energy to drive ATP synthesis in the next step (notes/glycolysis-energetics-glycogen-2026-08-10.md §7). PEP's instability comes from the phosphate group: if that phosphate were removed and replaced by a simple OH, the molecule would spontaneously rearrange from the less stable enol form to the more stable keto form (a process called keto-enol tautomerization). The phosphate effectively "pins" the molecule in its high-energy enol state, storing energy that will be released when pyruvate kinase removes the phosphate in the next step (notes/glycolysis-energetics-glycogen-2026-08-10.md §7).
Step 10 — Pyruvate Kinase
phosphoenolpyruvate (PEP) + ADP --[Pyruvate kinase]--> pyruvate + ATP
- Enzyme: Pyruvate kinase (notes/glycolysis-energetics-glycogen-2026-08-10.md §8).
- Cofactor: None explicitly listed (notes/glycolysis-energetics-glycogen-2026-08-10.md §8; HW1 p.3).
- Reversibility: Irreversible (one-way). Pyruvate kinase is an allosteric enzyme (notes/glycolysis-energetics-glycogen-2026-08-10.md §8, §13).
- Rationale: Once pyruvate kinase removes the phosphate from PEP, the molecule spontaneously undergoes the keto-enol tautomerization that was blocked while the phosphate was attached. This rearrangement is highly favorable and provides a large negative free-energy change that drives the reaction irreversibly forward (notes/glycolysis-energetics-glycogen-2026-08-10.md §8). The released phosphate is transferred to ADP, generating one ATP per PEP — two per glucose (notes/glycolysis-energetics-glycogen-2026-08-10.md §8).
Glycolysis is now complete. Starting from one glucose, the pathway has produced 2 pyruvate, a net of 2 ATP, and 2 NADH (notes/glycolysis-energetics-glycogen-2026-08-10.md §9).
Fermentation: regenerating NAD⁺
The NADH produced in step 6 creates a problem. NAD⁺ exists in a very small pool inside the cell — there is not much of it available at any given moment (notes/glycolysis-energetics-glycogen-2026-08-10.md §9). If all the NAD⁺ is converted to NADH and cannot be regenerated, step 6 stops, and glycolysis grinds to a halt. Fermentation is the solution: it oxidizes NADH back to NAD⁺ so that glycolysis can continue turning (notes/glycolysis-energetics-glycogen-2026-08-10.md §9).
There are two major fermentation branches, depending on the organism.
Fermentation Branch A — Lactic acid fermentation (LDH)
pyruvate + NADH + H+ --[Lactate dehydrogenase (LDH)]--> L-lactate + NAD+
Lactate dehydrogenase (LDH) converts pyruvate to L-lactate, transferring the hydride from NADH back to the substrate and regenerating NAD⁺ (notes/glycolysis-energetics-glycogen-2026-08-10.md §9). This branch occurs in mammalian muscle and many other cell types. The net ATP yield remains 2 ATP per glucose (notes/glycolysis-energetics-glycogen-2026-08-10.md §9). For more on the LDH reaction and how it is measured spectrophotometrically, see Primer C.
Fermentation Branch B — Alcoholic fermentation
In organisms such as yeast, pyruvate takes a two-step detour to ethanol instead of lactate (notes/glycolysis-energetics-glycogen-2026-08-10.md §10):
Step B1 — Pyruvate decarboxylase:
pyruvate --[Pyruvate decarboxylase; Mg2+, TPP]--> acetaldehyde + CO2
Pyruvate decarboxylase removes one carbon from pyruvate as CO₂, producing the two-carbon compound acetaldehyde (notes/glycolysis-energetics-glycogen-2026-08-10.md §10). This enzyme requires two helpers: the metal-ion cofactor Mg²⁺ and the organic coenzyme TPP (thiamine pyrophosphate) (notes/glycolysis-energetics-glycogen-2026-08-10.md §10). The reaction is irreversible (one-way), and pyruvate decarboxylase is an allosteric enzyme (notes/glycolysis-energetics-glycogen-2026-08-10.md §10, §13). CO₂ is nonpolar and diffuses freely out of the yeast cell through the membrane (notes/glycolysis-energetics-glycogen-2026-08-10.md §10).
Step B2 — Alcohol dehydrogenase:
acetaldehyde + NADH + H+ --[Alcohol dehydrogenase]--> ethanol + NAD+
Alcohol dehydrogenase reduces acetaldehyde to ethanol, regenerating NAD⁺ from NADH — the same essential purpose as LDH in the lactate branch (notes/glycolysis-energetics-glycogen-2026-08-10.md §10). The net ATP yield from alcoholic fermentation is also 2 ATP per glucose (notes/glycolysis-energetics-glycogen-2026-08-10.md §10).
If asked to draw the full alcoholic fermentation pathway on an exam, include all ten steps of glycolysis followed by the two fermentation steps — the pathway begins at glucose, not at pyruvate (notes/glycolysis-energetics-glycogen-2026-08-10.md §10).
Summary tables
The following four tables condense the pathway information that the homework asks you to learn (HW1 p.1).
Table 1 — ATP accounting (per glucose)
| Event | Step | ATP change |
|---|---|---|
| Hexokinase consumes ATP | 1 | −1 |
| PFK1 consumes ATP | 3 | −1 |
| Phosphoglycerate kinase produces ATP (x2 per glucose) | 7 | +2 |
| Pyruvate kinase produces ATP (x2 per glucose) | 10 | +2 |
| Total consumed | 2 | |
| Total produced | 4 | |
| Net ATP per glucose | +2 |
(notes/glycolysis-energetics-glycogen-2026-08-10.md §5, §9)
Table 2 — Cofactor and coenzyme requirements
| Step | Enzyme | Cofactor / Coenzyme | Role |
|---|---|---|---|
| 1 | Hexokinase | Mg²⁺ (cofactor) | Shields ATP negative charges so the C6 OH nucleophile can attack phosphorus (notes/microcalorimetry-and-glycolysis-intro-2026-08-05.md §25) |
| 2 | PGI | None | — |
| 3 | PFK1 | None | — |
| 4 | Aldolase | None | — |
| 5 | TPI | None | — |
| 6 | G3PDH | NAD⁺ (coenzyme) | Accepts a hydride from G3P; reduced to NADH (notes/glycolysis-energetics-glycogen-2026-08-10.md §3) |
| 7 | Phosphoglycerate kinase | Mg²⁺ (cofactor) | Required for kinase activity (slides: Lecture 6 p.2) |
| 8 | Phosphoglycerate mutase | None | — |
| 9 | Enolase | None | — |
| 10 | Pyruvate kinase | None | — |
| LDH | Lactate dehydrogenase | NADH (coenzyme) | Donates hydride to pyruvate; oxidized to NAD⁺ (notes/glycolysis-energetics-glycogen-2026-08-10.md §9) |
| B1 | Pyruvate decarboxylase | Mg²⁺ (cofactor), TPP (coenzyme) | Mg²⁺ stabilizes the reaction; TPP assists decarboxylation (notes/glycolysis-energetics-glycogen-2026-08-10.md §10) |
| B2 | Alcohol dehydrogenase | NADH (coenzyme) | Donates hydride to acetaldehyde; oxidized to NAD⁺ (notes/glycolysis-energetics-glycogen-2026-08-10.md §10) |
(notes/microcalorimetry-and-glycolysis-intro-2026-08-05.md §24--§29; notes/glycolysis-energetics-glycogen-2026-08-10.md §1--§10; HW1 p.3)
Table 3 — Regulation (allosteric enzymes)
| Step | Enzyme | Allosteric? | Direction | Known effectors |
|---|---|---|---|---|
| 1 | Hexokinase | Yes | Irreversible | Not detailed in lecture |
| 3 | PFK1 | Yes | Irreversible | ADP (activator, +); ATP (inhibitor, −) |
| 10 | Pyruvate kinase | Yes | Irreversible | Not detailed in lecture |
| B1 | Pyruvate decarboxylase | Yes | Irreversible | Not detailed in lecture |
(notes/glycolysis-energetics-glycogen-2026-08-10.md §13)
A useful generalization: reactions with large negative ΔG values are typically catalyzed by allosteric enzymes with multiple subunits, which produce sigmoidal (S-shaped) velocity-versus-substrate curves rather than the hyperbolic curves of Michaelis-Menten enzymes (notes/glycolysis-energetics-glycogen-2026-08-10.md §11, §13). For background on these two kinetic models, see Primer D.
PFK1 is the best-characterized example of allosteric regulation in glycolysis (notes/glycolysis-energetics-glycogen-2026-08-10.md §13):
- When ADP accumulates (signaling that the cell is running low on energy), ADP binds to a regulatory site separate from the active site, changes the enzyme's shape, and speeds up the reaction — a positive allosteric effector (activator) (notes/glycolysis-energetics-glycogen-2026-08-10.md §13).
- When ATP accumulates (signaling that the cell already has sufficient energy), ATP binds to the regulatory site and slows the enzyme down — a negative allosteric effector (inhibitor) (notes/glycolysis-energetics-glycogen-2026-08-10.md §13).
- Allosteric inhibition slows the reaction but never reduces the rate to absolute zero — nothing in metabolism ever shuts off completely (notes/glycolysis-energetics-glycogen-2026-08-10.md §13).
Table 4 — Reversibility
| Step | Enzyme | Reversible? |
|---|---|---|
| 1 | Hexokinase | Irreversible |
| 2 | PGI | Reversible |
| 3 | PFK1 | Irreversible |
| 4 | Aldolase | Reversible |
| 5 | TPI | Reversible |
| 6 | G3PDH | Reversible |
| 7 | Phosphoglycerate kinase | Reversible |
| 8 | Phosphoglycerate mutase | Reversible |
| 9 | Enolase | Reversible |
| 10 | Pyruvate kinase | Irreversible |
(notes/glycolysis-energetics-glycogen-2026-08-10.md §13; notes/microcalorimetry-and-glycolysis-intro-2026-08-05.md §27--§29; notes/glycolysis-energetics-glycogen-2026-08-10.md §1, §5--§8)
The three irreversible steps (1, 3, and 10) are exactly the three catalyzed by allosteric enzymes. This is not a coincidence: these are the control points where the cell regulates the flow of carbon through glycolysis (notes/glycolysis-energetics-glycogen-2026-08-10.md §13).
Check yourself (original practice — not from the course): In step 6 of glycolysis, name the substrate, the product, the enzyme, and any required cofactor or coenzyme. What type of high-energy bond is present in the product? Why does the cell use inorganic phosphate (Pi) rather than water in this reaction?
Answer: The substrate is glyceraldehyde-3-phosphate (G3P) and the product is 1,3-bisphosphoglycerate (1,3-BPG). The enzyme is glyceraldehyde-3-phosphate dehydrogenase (G3PDH), and it requires the coenzyme NAD⁺ (which is reduced to NADH). The high-energy bond in 1,3-BPG is an acyl phosphate — a phosphate attached to a carbonyl carbon. The cell uses Pi rather than water because Pi traps the oxidation energy in the acyl phosphate bond; if water were used instead, that energy would dissipate as heat and entropy, and no ATP could be made in the next step.
Lecture-note cross-references: notes/microcalorimetry-and-glycolysis-intro-2026-08-05.md §21--§29; notes/glycolysis-energetics-glycogen-2026-08-10.md §1--§11, §13--§14.
Lipid Structures: Triglycerides and Phospholipids
The homework asks you to draw three types of lipid molecules -- a triglyceride (also called a triacylglycerol, commonly known as fat), and two phospholipids called phosphatidylcholine and phosphatidylserine -- using any combination of five named fatty acids (HW1 p.1). This is a drawing skill, not a question with a single numeric answer: the exam may specify particular fatty acids at particular positions and ask you to draw the complete molecule (notes/dna-microarrays-2d-gel-electrophoresis-2026-08-04.md §8).
Before you can draw any of these lipids, you need to understand four things: what a fatty acid is, how fatty acids attach to a glycerol backbone, how a triglyceride differs from a phospholipid, and how the specific head groups (choline and serine) attach to the phospholipid scaffold. This section teaches each building block in order and then walks through all three drawings as worked examples. All of this material comes from the BIS-102 review lecture on fatty acids and lipids (slides: Lecture 2 pp.9--10; notes/dna-microarrays-2d-gel-electrophoresis-2026-08-04.md §6--§8).
One orientation point before we start: lipids are a family of biological molecules, and scientists classify them into seven classes. BIS-103 covers two of those classes -- the acylglycerols (energy-storage fats) and the phospholipids (membrane builders) (notes/dna-microarrays-2d-gel-electrophoresis-2026-08-04.md §7, §8). Fatty acids themselves are parts of lipids, not lipids in their own right (notes/dna-microarrays-2d-gel-electrophoresis-2026-08-04.md §6).
Fatty-acid anatomy and shorthand
A fatty acid is a chain of carbon atoms with a carboxyl group (--COOH) at one end. The carboxyl carbon is always numbered carbon 1, and you count along the chain starting from it (notes/dna-microarrays-2d-gel-electrophoresis-2026-08-04.md §6). The carboxyl group is a weak acid: at cellular pH (around 7), it loses its proton and becomes --COO⁻. When the carboxyl ionizes, the name changes -- palmitic acid becomes palmitate, stearic acid becomes stearate, and so on (notes/dna-microarrays-2d-gel-electrophoresis-2026-08-04.md §6). (This acid-to-conjugate-base behavior is exactly the chemistry taught in Primer A.)
Shorthand notation. Fatty acids are written in a compact format that packs the entire structure into a few numbers (notes/dna-microarrays-2d-gel-electrophoresis-2026-08-04.md §6):
- The first number is the total count of carbons.
- The number after the colon is the count of carbon-carbon double bonds.
- The numbers in parentheses are the carbon positions where each double bond begins.
For example, 18:1(9) means 18 carbons total, one double bond, beginning at carbon 9 -- that is, the double bond sits between carbons 9 and 10 (notes/dna-microarrays-2d-gel-electrophoresis-2026-08-04.md §6).
Fatty acids with no double bonds are called saturated (every carbon in the chain carries the maximum number of hydrogens). Fatty acids with one or more double bonds are called unsaturated (notes/dna-microarrays-2d-gel-electrophoresis-2026-08-04.md §6).
The five fatty acids to know
The homework names exactly five fatty acids you must be able to use (HW1 p.1). The lecturer covered all five in the BIS-102 review (notes/dna-microarrays-2d-gel-electrophoresis-2026-08-04.md §6; slides: Lecture 2 p.9):
| Shorthand | Common name | Class | Double bonds |
|---|---|---|---|
| 16:0 | Palmitic acid (palmitate) | Saturated | None |
| 18:0 | Stearic acid (stearate) | Saturated | None |
| 18:1(9) | Oleic acid (oleate) | Unsaturated | 1 cis, between C9 and C10 |
| 18:2(9,12) | Linoleic acid (linoleate) | Unsaturated | 2 cis, beginning at C9 and C12 |
| 18:3(9,12,15) | Alpha-linolenic acid (alpha-linolenate) | Unsaturated | 3 cis, beginning at C9, C12, and C15 |
(Table contents: notes/dna-microarrays-2d-gel-electrophoresis-2026-08-04.md §6; the same five acids are listed in the directive, HW1 p.1.)
Notice the pattern in the unsaturated acids: each adds one more double bond, always three carbons farther along the chain (C9, then C12, then C15) (notes/dna-microarrays-2d-gel-electrophoresis-2026-08-04.md §6).
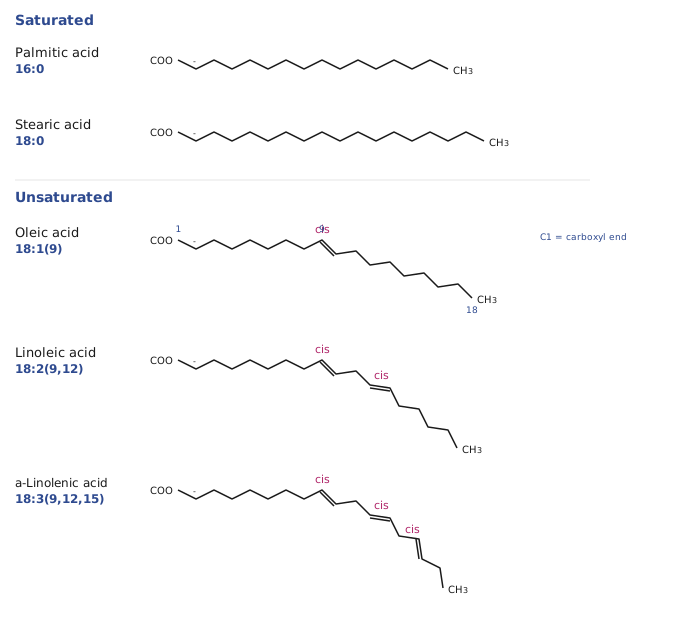
Exam emphasis: On exams, students are typically asked to number the carbons in fatty acid structures, so practice counting from the carboxyl carbon as carbon 1 (notes/dna-microarrays-2d-gel-electrophoresis-2026-08-04.md §6).
The cis-kink rule
Every double bond in these five fatty acids has the cis configuration: the two parts of the carbon chain continue on the same side of the double bond. This is not random -- the enzymes that form these double bonds are stereospecific and always produce the cis arrangement (notes/dna-microarrays-2d-gel-electrophoresis-2026-08-04.md §6).
The cis geometry forces a sharp bend -- a kink -- in the chain at each double bond. A saturated chain has no double bonds and therefore no kinks, so it draws as a straight zigzag. An unsaturated chain bends once at every cis double bond (notes/dna-microarrays-2d-gel-electrophoresis-2026-08-04.md §6). So when you draw 18:2(9,12), your chain must visibly bend at carbon 9 and again at carbon 12. When you draw 18:3(9,12,15), the chain bends three times.
Why kinks matter biologically. In membranes, kinked chains cannot pack together as tightly as straight ones, so membranes containing more unsaturated fatty acids can move more easily -- the kinks increase membrane fluidity (notes/dna-microarrays-2d-gel-electrophoresis-2026-08-04.md §6).
Free fatty acids act as detergents. The lecturer made an instructive comparison: SDS -- the harsh detergent used to denature proteins for gel electrophoresis -- is a 12-carbon chain with a negative charge, and palmitate is a 16-carbon chain with a negative charge. They are structurally similar. Only sick or dying cells have lots of free fatty acids; normally, fatty acids are covalently attached to other compounds to prevent this detergent activity (notes/dna-microarrays-2d-gel-electrophoresis-2026-08-04.md §6). The triglycerides and phospholipids you are about to draw are exactly those "other compounds."
Glycerol backbone and sn-numbering
Both triglycerides and phospholipids are built on a three-carbon backbone called glycerol. Glycerol has three carbons, each originally bearing a hydroxyl group (--OH). Fatty acids attach to these positions through ester bonds -- covalent linkages formed when a fatty acid's carboxyl group reacts with one of glycerol's hydroxyls, releasing water (notes/dna-microarrays-2d-gel-electrophoresis-2026-08-04.md §7).
L-glycerol. When you draw the glycerol backbone vertically, the hydroxyl on carbon 2 goes to the left. This left-handed form, L-glycerol, is the one most organisms use. Archaea use D-glycerol (the hydroxyl on carbon 2 written to the right), for reasons unknown (notes/dna-microarrays-2d-gel-electrophoresis-2026-08-04.md §7).
sn-numbering. The three positions on glycerol are labeled sn-1, sn-2, and sn-3 (top to bottom when drawn vertically). Throughout this section, read "sn-N" as "position N of the glycerol backbone" (notes/dna-microarrays-2d-gel-electrophoresis-2026-08-04.md §7).
Enzyme specificity at each position. The cell uses a different enzyme to attach a fatty acid at each glycerol position -- one enzyme for sn-1, a different one for sn-2, a third for sn-3. Separate enzymes remove fatty acids from each position. These enzymes are very specific and very fast, so cells do not need many copies (notes/dna-microarrays-2d-gel-electrophoresis-2026-08-04.md §7). Enzymes can easily distinguish left-handed from right-handed molecules in three dimensions because they grip their targets with many weak bonds -- perhaps 20 (notes/dna-microarrays-2d-gel-electrophoresis-2026-08-04.md §7).
Worked example: drawing a triglyceride
A triglyceride (triacylglycerol) has a fatty acid attached via an ester bond at all three glycerol positions -- sn-1, sn-2, and sn-3. The homework directive allows any of the five fatty acids at each position (HW1 p.1).
Triglycerides are not found in membranes. They are energy-storage molecules: one triglyceride molecule holds a large amount of chemical energy because it carries three long fatty acid chains plus the glycerol backbone (notes/dna-microarrays-2d-gel-electrophoresis-2026-08-04.md §7). Stearic acid alone (18 carbons) contains far more energy per molecule than glucose (6 carbons); burning fatty acids requires proportionally more exercise per molecule (notes/dna-microarrays-2d-gel-electrophoresis-2026-08-04.md §6). The body breaks down triacylglycerols for energy when food is not available, to feed the brain, muscles, and other tissues (notes/dna-microarrays-2d-gel-electrophoresis-2026-08-04.md §7).
Step-by-step: draw a triglyceride with oleic acid 18:1(9) at sn-1, palmitic acid 16:0 at sn-2, and linoleic acid 18:2(9,12) at sn-3.
Step 1 -- Draw the glycerol backbone. Draw three carbons in a vertical column, numbered sn-1 (top) through sn-3 (bottom). Write the carbon-2 hydroxyl to the left so the backbone is L-glycerol (notes/dna-microarrays-2d-gel-electrophoresis-2026-08-04.md §7).
Step 2 -- Attach oleic acid at sn-1. Form an ester bond: the glycerol's hydroxyl and the fatty acid's carboxyl react, releasing water. The resulting linkage is glycerol-C--O--C(=O)--chain. Draw the 18-carbon chain with one cis kink between carbons 9 and 10 (notes/dna-microarrays-2d-gel-electrophoresis-2026-08-04.md §6, §7).
Step 3 -- Attach palmitic acid at sn-2. Form an ester bond. Draw a straight 16-carbon zigzag -- 16:0 is saturated, so there are no kinks (notes/dna-microarrays-2d-gel-electrophoresis-2026-08-04.md §6).
Step 4 -- Attach linoleic acid at sn-3. Form an ester bond. Draw the 18-carbon chain with two cis kinks, one at carbon 9 and one at carbon 12 (notes/dna-microarrays-2d-gel-electrophoresis-2026-08-04.md §6).
Step 5 -- Label. Mark each of the three ester bonds. Number the carbons of each fatty acid chain starting from the carboxyl carbon as carbon 1.
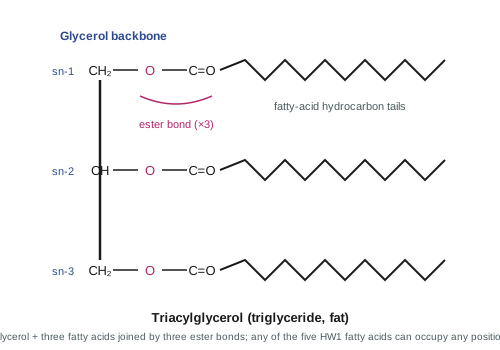
The finished drawing: L-glycerol with three fatty acids -- 18:1(9) at sn-1, 16:0 at sn-2, and 18:2(9,12) at sn-3 -- each joined by an ester bond. This is a triacylglycerol (notes/dna-microarrays-2d-gel-electrophoresis-2026-08-04.md §7).
Key points to remember about triglycerides:
- All three glycerol positions carry a fatty acid -- that is what makes it a triacylglycerol (notes/dna-microarrays-2d-gel-electrophoresis-2026-08-04.md §7).
- Triglycerides carry no net charge at pH 7 (no phosphate, no ionizable head group), so they are completely nonpolar and insoluble in water.
- Any of the five fatty acids may go at any position (HW1 p.1).
Worked example: drawing phosphatidylcholine
Phospholipids are the second lipid class. Their job is membrane construction -- they form the lipid bilayer of the plasma membrane and organelle membranes such as the Golgi apparatus (notes/dna-microarrays-2d-gel-electrophoresis-2026-08-04.md §8).
A phospholipid differs from a triglyceride at exactly one position: sn-1 and sn-2 still carry fatty acids attached by ester bonds, but sn-3 carries a phosphate group instead of a third fatty acid. The phosphate is in turn linked to an alcohol, and the bond connecting glycerol--phosphate--alcohol is called a phosphodiester (notes/dna-microarrays-2d-gel-electrophoresis-2026-08-04.md §8). Phosphodiesters are extremely common in biology -- the backbones of DNA and RNA are chains of sugar--phosphate--sugar--phosphate, all connected by phosphodiesters (notes/dna-microarrays-2d-gel-electrophoresis-2026-08-04.md §8).
Can the phosphate go on sn-1 or sn-2 instead? No -- only on sn-3. The enzyme that places the phosphate is stereospecific and never makes a mistake; a mutation causing an error would likely be lethal (notes/dna-microarrays-2d-gel-electrophoresis-2026-08-04.md §8).
Phosphatidylcholine is one of two phospholipids you must know. The alcohol attached to the phosphate through the phosphodiester is choline (notes/dna-microarrays-2d-gel-electrophoresis-2026-08-04.md §8).
Step-by-step: draw phosphatidylcholine with stearic acid 18:0 at sn-1 and oleic acid 18:1(9) at sn-2.
Step 1 -- Backbone and fatty acid tails. Draw L-glycerol vertically (sn-1 top, sn-2 middle, sn-3 bottom). Ester-bond stearic acid (18:0) at sn-1: a straight 18-carbon zigzag, no kinks. Ester-bond oleic acid (18:1(9)) at sn-2: an 18-carbon chain with one cis kink at carbon 9 (notes/dna-microarrays-2d-gel-electrophoresis-2026-08-04.md §6, §8).
Step 2 -- Phosphate at sn-3. Instead of a fatty acid, attach the phosphate group at sn-3. At pH 7, the phosphate carries a --1 charge (notes/dna-microarrays-2d-gel-electrophoresis-2026-08-04.md §8).
Step 3 -- Choline head group. Attach choline to the other side of the phosphate, completing the phosphodiester. The choline structure extends: --O--CH₂--CH₂--N⁺(CH₃)₃ (notes/dna-microarrays-2d-gel-electrophoresis-2026-08-04.md §8).
Step 4 -- Mark the quaternary amine. The nitrogen in choline has four groups bonded to it (three methyl groups plus the ethyl chain to the phosphate). A nitrogen with four bonds is called a quaternary amine, and it always carries a +1 charge regardless of pH -- there is no proton to lose or gain (notes/dna-microarrays-2d-gel-electrophoresis-2026-08-04.md §8).
Step 5 -- Identify the two regions. The phosphate-plus-choline end is the hydrophilic head (charged, interacts with water). The two fatty acid chains are the hydrophobic tails (nonpolar, avoids water). This dual nature is what allows phospholipids to form the membrane bilayer.
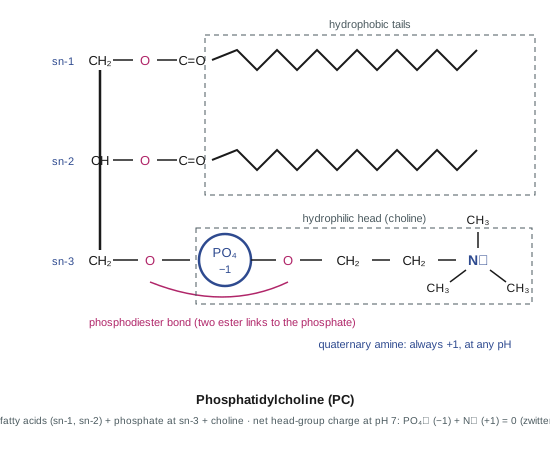
Charge summary for phosphatidylcholine at pH 7:
| Head-group component | Charge |
|---|---|
| Phosphate | --1 |
| Quaternary amine on choline | +1 |
| Net head-group charge | 0 |
The phosphate's --1 and choline's permanent +1 cancel, so the PC head group has a net charge of zero at physiological pH.
Worked example: drawing phosphatidylserine
The second phospholipid you must know reuses the entire scaffold you just drew -- the only thing that changes is the head group. In phosphatidylserine, the amino acid serine takes the place of choline, attached to the phosphate through the same phosphodiester bond (notes/dna-microarrays-2d-gel-electrophoresis-2026-08-04.md §8). The lecturer noted that amino acids serve functions beyond building proteins -- here one serves as a membrane lipid's head group (notes/dna-microarrays-2d-gel-electrophoresis-2026-08-04.md §8).
Step-by-step: draw phosphatidylserine with palmitic acid 16:0 at sn-1 and linoleic acid 18:2(9,12) at sn-2.
Steps 1--2 are identical to phosphatidylcholine: Draw L-glycerol vertically. Ester-bond palmitic acid (16:0) at sn-1: a straight 16-carbon zigzag, no kinks. Ester-bond linoleic acid (18:2(9,12)) at sn-2: an 18-carbon chain with two cis kinks at carbons 9 and 12. Attach the phosphate at sn-3 (notes/dna-microarrays-2d-gel-electrophoresis-2026-08-04.md §6, §8).
Step 3 -- Serine head group. Attach serine to the phosphate through the phosphodiester. At pH 7, serine's structure is: --O--CH₂--CH(NH₃⁺)(COO⁻). Draw the serine showing both its amino group (NH₃⁺, protonated and positively charged at pH 7) and its carboxylate group (COO⁻, deprotonated and negatively charged at pH 7) (notes/dna-microarrays-2d-gel-electrophoresis-2026-08-04.md §8).
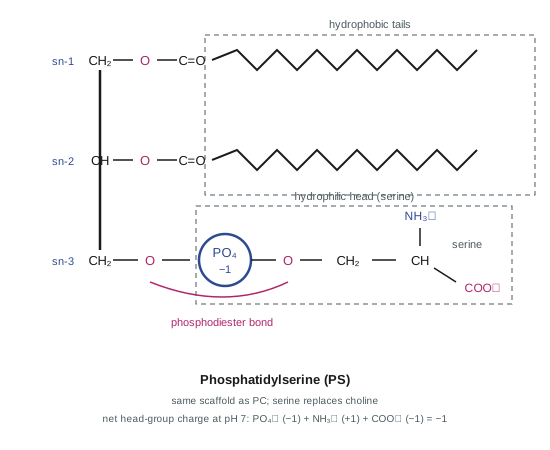
Charge summary for phosphatidylserine at pH 7:
| Head-group component | Charge |
|---|---|
| Phosphate | --1 |
| Serine amino group (NH₃⁺) | +1 |
| Serine carboxylate (COO⁻) | --1 |
| Net head-group charge | --1 |
Unlike phosphatidylcholine, phosphatidylserine carries a net negative charge of --1 at physiological pH. Choline contributes only one charged group (the quaternary amine, always +1), which fully cancels the phosphate's --1. Serine contributes two charged groups (NH₃⁺ at +1 and COO⁻ at --1), so one negative charge is left over after all the cancellations.
Exam emphasis: Students may be asked to draw specific phospholipids at a given pH with designated fatty acids at each position -- for example, "draw phosphatidylserine at pH 7 with palmitate at position 1 and stearic acid at position 2" (notes/dna-microarrays-2d-gel-electrophoresis-2026-08-04.md §8). That is exactly the skill these worked examples build.
Triglyceride vs. phospholipid at a glance
| Feature | Triglyceride | Phospholipid (PC or PS) |
|---|---|---|
| Fatty acids | 3 (at sn-1, sn-2, and sn-3) | 2 (at sn-1 and sn-2 only) |
| What occupies sn-3 | A third fatty acid (ester bond) | Phosphate + head-group alcohol (phosphodiester) |
| Net charge at pH 7 | 0 (no charged groups) | 0 (PC) or --1 (PS) |
| Biological role | Energy storage ("fat") | Membrane construction |
| Found in membranes? | No | Yes |
(notes/dna-microarrays-2d-gel-electrophoresis-2026-08-04.md §7, §8)
Check yourself
Check yourself (original practice -- not from the course): Draw phosphatidylcholine with 18:0 (stearic acid) at sn-1 and 18:3(9,12,15) (alpha-linolenic acid) at sn-2. How many cis kinks appear in the sn-2 chain? What is the net charge of the head group at pH 7?
Answer: Start with L-glycerol drawn vertically. At sn-1, ester-bond stearic acid (18:0): a straight 18-carbon zigzag with no kinks (saturated, zero double bonds). At sn-2, ester-bond alpha-linolenic acid (18:3(9,12,15)): an 18-carbon chain with three cis kinks at carbons 9, 12, and 15. At sn-3, attach the phosphate and link choline through the phosphodiester. The choline nitrogen is a quaternary amine (four groups bonded to nitrogen), always carrying +1. Net head-group charge = phosphate (--1) + quaternary amine (+1) = 0.
Lecture-note cross-references: notes/dna-microarrays-2d-gel-electrophoresis-2026-08-04.md §6 (fatty acids), §7 (acylglycerols), §8 (phospholipids).
Part III — Problem-by-Problem Worked Solutions
Every module in this part follows the same five-heading template: what the question asks, what you need to know first, the step-by-step solution with every answer fully visible, common pitfalls, and one original check-yourself variant. Modules keep the homework's own numbering (Q1, Q2, Q3a–Q3i) so you can work with the homework in hand (HW1 pp.1–2).
Q1 — DNA Microarray Lab Exercise
What the question asks
Question 1 is an interactive assignment rather than a calculation: it asks you to work through an online DNA microarray laboratory exercise, the point being to learn, step by step, how a microarray experiment is actually carried out in the lab (HW1 Q1). The given information is the exercise itself: the lab lives at https://learn.genetics.utah.edu/content/labs/microarray/, it is organized into three chapters, you answer the quiz questions at the end of chapter 3, the stated time budget is half an hour or less, and the site requires the Adobe Flash plugin to run (HW1 Q1).
One thing to know up front: the answer key restates the assignment's instructions and does not supply answers to the chapter 3 questions (Key HW1 p.1). So this module does what the exercise is for — it walks the entire microarray experiment start to finish, exactly as it was taught in lecture, and finishes with the interpretation rules that let you read a scanned microarray (notes/dna-microarrays-2d-gel-electrophoresis-2026-08-04.md §9–§16).
What you need to know first
This module is self-contained: everything below is taught here, from zero. The only outside concept it touches is absorbance, which is taught in Primer B.
Genes, mRNA, and gene expression. All cells — animal, plant, and bacterial — use DNA as their genetic code (notes/course-intro-metabolism-overview-2026-08-03.md §8). A gene is a piece of that DNA, and a gene can be used to produce a protein — this is why, for example, a human gene inserted into bacteria makes the bacteria produce large quantities of the human protein (notes/course-intro-metabolism-overview-2026-08-03.md §8). When a cell is actively using a gene, we say the gene is expressed, and the protein a gene specifies is called its encoded protein (notes/dna-microarrays-2d-gel-electrophoresis-2026-08-04.md §16–§17). The intermediate between a gene and its protein is messenger RNA (mRNA): the set of mRNAs a cell is making at the moment you look tells you which genes that cell is actively using, and determining that set is exactly what a DNA microarray does (notes/course-intro-metabolism-overview-2026-08-03.md §12; notes/dna-microarrays-2d-gel-electrophoresis-2026-08-04.md §9).
Base pairing and hybridization. Nucleic acid strands are written 5′ to 3′ (notes/dna-microarrays-2d-gel-electrophoresis-2026-08-04.md §9). Two strands can pair with each other through weak hydrogen bonds between their bases: A pairs with T (this is how a poly-A stretch binds a poly-T stretch), G pairs with C, and in an RNA–DNA pairing an A in the DNA sits opposite a U in the RNA (notes/dna-microarrays-2d-gel-electrophoresis-2026-08-04.md §9, §13; slides: Lecture 3 p.4). Two paired strands form a duplex; the sugar–phosphate backbone of each strand carries negative charges, so the two strands repel each other unless positively charged ions in the solution shield those charges (notes/dna-microarrays-2d-gel-electrophoresis-2026-08-04.md §12). Because the pairing bonds are weak, they can break and reform — pairing is dynamic, not permanent (notes/dna-microarrays-2d-gel-electrophoresis-2026-08-04.md §9). Hybridization is this same pairing put to work as a tool: a single-stranded nucleic acid finds and binds the strand complementary to it (notes/dna-microarrays-2d-gel-electrophoresis-2026-08-04.md §14, §16).
Control vs. experimental samples. A microarray experiment is always comparative: you never ask "what is this cell expressing?" in isolation, but "what is different between these two cell types?" (notes/course-intro-metabolism-overview-2026-08-03.md §12). One sample is the experimental condition — in lecture, cancer cells — and the other is the control, the normal cells you compare against; the whole procedure below is run in duplicate, once per sample (notes/dna-microarrays-2d-gel-electrophoresis-2026-08-04.md §9).
Three tools the experiment uses, each taught in place at the step that needs it:
- an affinity column that fishes mRNA out of a mixture using A–T base pairing (step 1),
- reverse transcriptase, an enzyme that copies an RNA template into a DNA strand called cDNA (step 2),
- fluorescent labeling — chemically attaching a group that emits colored light at a longer wavelength when excited by light, so that an otherwise colorless molecule becomes visible to a scanner (step 2) (notes/dna-microarrays-2d-gel-electrophoresis-2026-08-04.md §9, §13).
Step-by-step solution
The figure below is the roadmap; each numbered step is then worked in detail.
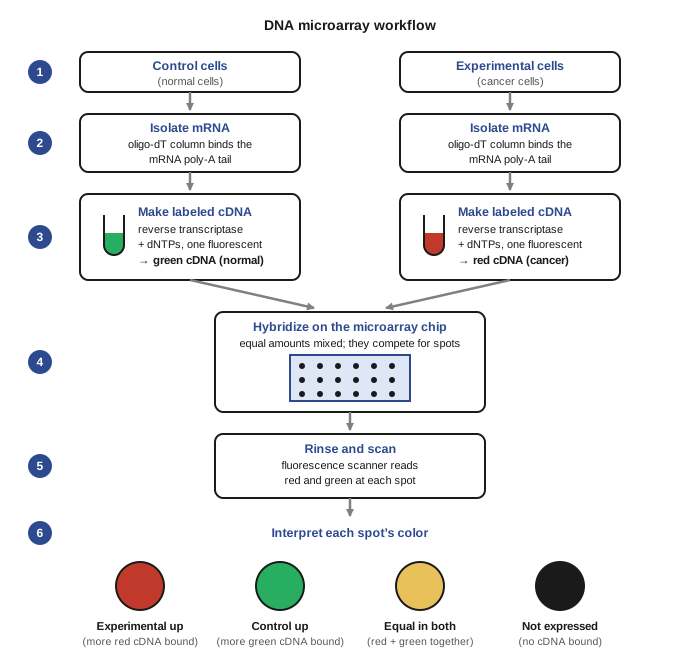
Step 1 — Extract RNA and isolate the mRNA from each sample.
Total RNA is extracted from the cells using an organic solvent, but that extract contains transfer RNA (tRNA) and ribosomal RNA (rRNA) as well as the mRNA we want (notes/dna-microarrays-2d-gel-electrophoresis-2026-08-04.md §9). What makes mRNA separable is a structural tag: mRNA carries a poly-A tail — a stretch of adenine nucleotides at its 3′ end — which tRNA and rRNA lack (notes/dna-microarrays-2d-gel-electrophoresis-2026-08-04.md §9).
The separation uses an affinity column: beads packed in a column, with the ligand polydeoxythymidine (oligo-dT) covalently attached directly to the beads — no spacer arm is needed because mRNA is a linear molecule, not a three-dimensional enzyme that has to reach the ligand with an active site (notes/dna-microarrays-2d-gel-electrophoresis-2026-08-04.md §9). The poly-A tails hydrogen-bond to the oligo-dT (A pairs with T); each individual bond is weak and keeps breaking and reforming, but the beads carry so many oligo-dT copies that the mRNA stays retained on the column, while tRNA and rRNA never bind and flow straight through (notes/dna-microarrays-2d-gel-electrophoresis-2026-08-04.md §9). A plastic fritted disc at the bottom of the column has holes small enough to trap the beads but large enough to pass buffer and dissolved molecules (notes/dna-microarrays-2d-gel-electrophoresis-2026-08-04.md §9; slides: Lecture 3 p.3).
Progress is monitored by absorbance (see Primer B for what absorbance is): nucleic acids absorb ultraviolet light at 260 nm because of the conjugated double bonds in their nitrogenous bases, so A₂₆₀ is measured on each fraction leaving the column (notes/dna-microarrays-2d-gel-electrophoresis-2026-08-04.md §10). The first fractions show high A₂₆₀ — that is the tRNA and rRNA flowing through, and it is discarded (notes/dna-microarrays-2d-gel-electrophoresis-2026-08-04.md §10). The column is washed with buffer at the pH that maximizes binding (found by trial and error, about pH 7.5) until A₂₆₀ falls to zero (notes/dna-microarrays-2d-gel-electrophoresis-2026-08-04.md §10). Then the mRNA is eluted — released — by either changing the pH by a large amount, which disrupts the hydrogen bonds, or by lowering the salt concentration (notes/dna-microarrays-2d-gel-electrophoresis-2026-08-04.md §10). Low salt works because the negatively charged backbones of the paired strands are normally shielded by cations in the buffer; remove the cations and the strands repel each other and separate (notes/dna-microarrays-2d-gel-electrophoresis-2026-08-04.md §12). The eluted peak is the purified mRNA population (notes/dna-microarrays-2d-gel-electrophoresis-2026-08-04.md §10).
This is done on two identical columns: one for the experimental (cancer) cells' RNA, one for the control (normal) cells' RNA (notes/dna-microarrays-2d-gel-electrophoresis-2026-08-04.md §9).
Step 2 — Reverse-transcribe each mRNA population into fluorescent cDNA.
The mRNA itself is colorless and unstable, so each population is converted into fluorescently labeled DNA copies — cDNA (notes/dna-microarrays-2d-gel-electrophoresis-2026-08-04.md §13). For each population:
- Add oligo-dT primers in excess; they anneal to the poly-A tail and give the enzyme a double-stranded starting point, which every polymerase requires (notes/dna-microarrays-2d-gel-electrophoresis-2026-08-04.md §13).
- Add reverse transcriptase, the enzyme that uses an RNA template to synthesize a complementary DNA strand (notes/dna-microarrays-2d-gel-electrophoresis-2026-08-04.md §13).
- Add the four deoxynucleoside triphosphates (dATP, dGTP, dCTP, dTTP) — the building blocks and energy source for the new strand; without them no polymer can be made (notes/dna-microarrays-2d-gel-electrophoresis-2026-08-04.md §13).
- One of the four — dATP, chosen arbitrarily — carries a fluorescent group. Every time the enzyme incorporates a dATP opposite a uridine in the mRNA template, some of those incorporations carry the label; not every copy needs to be labeled, because full labeling would be too expensive (notes/dna-microarrays-2d-gel-electrophoresis-2026-08-04.md §13).
mRNA template + dATP* + dGTP + dCTP + dTTP --[reverse transcriptase]--> mRNA:cDNA duplex (cDNA fluorescently labeled)
This one step accomplishes two things at once: the invisible mRNA now has a visible color via its cDNA copy, and that copy is DNA, which is much more stable than RNA (notes/dna-microarrays-2d-gel-electrophoresis-2026-08-04.md §13).
The two samples get two different colors: the cancer (experimental) cDNA is labeled red and the normal (control) cDNA is labeled green (notes/dna-microarrays-2d-gel-electrophoresis-2026-08-04.md §13).
Step 3 — Destroy the mRNA template and neutralize.
The cDNA can only hybridize to the chip if it is single-stranded, so the mRNA template still paired to it must be destroyed (notes/dna-microarrays-2d-gel-electrophoresis-2026-08-04.md §14). The duplex is incubated in 1 M NaOH — a strong base at very high concentration — with heat for 15 minutes (notes/dna-microarrays-2d-gel-electrophoresis-2026-08-04.md §14). The base removes a proton from the 2′-hydroxyl of each RNA sugar; the resulting 2′-O⁻ attacks the neighboring phosphorus atom (which carries a partial positive charge because its surrounding electronegative oxygens pull electron density away), breaking the backbone's phosphodiester bond — at every nucleotide, fragmenting the mRNA completely (notes/dna-microarrays-2d-gel-electrophoresis-2026-08-04.md §14). The cDNA survives untouched for one structural reason: DNA has no 2′-hydroxyl, only a hydrogen at that position, so the destructive reaction cannot start (notes/dna-microarrays-2d-gel-electrophoresis-2026-08-04.md §14; slides: Lecture 3 p.4).
Then a critical cleanup: HCl is added to bring the pH back to 7, because at high pH the cDNA cannot form the hydrogen bonds it needs to bind the chip (notes/dna-microarrays-2d-gel-electrophoresis-2026-08-04.md §14).
Step 4 — Meet the chip.
The microarray itself is a microscope slide carrying a chip dotted with tiny spots of single-stranded DNA, costing roughly $800 per slide (notes/dna-microarrays-2d-gel-electrophoresis-2026-08-04.md §15). Each dot holds many identical copies of one gene's DNA sequence, deposited by machine in roughly one-nanoliter volumes — far too small to pipette by hand — and adjacent dots are different genes; a single chip might represent one whole chromosome (notes/dna-microarrays-2d-gel-electrophoresis-2026-08-04.md §15). Every dot must carry approximately the same number of DNA copies so the comparison is fair, and the single strands act as receptors waiting for complementary cDNA (notes/dna-microarrays-2d-gel-electrophoresis-2026-08-04.md §15). Only the manufacturer knows which gene sits at which position — that information is part of what you are paying for (notes/dna-microarrays-2d-gel-electrophoresis-2026-08-04.md §15).
Step 5 — Hybridize both cDNA populations to the chip, then rinse.
Equal amounts of red (cancer) and green (normal) cDNA are pipetted into a container holding the chip and a buffer whose pH and conditions the company has optimized (notes/dna-microarrays-2d-gel-electrophoresis-2026-08-04.md §16). The mixture is incubated with rotation, and the red and green cDNAs compete for the binding spots — the lecturer compared it to musical chairs (notes/dna-microarrays-2d-gel-electrophoresis-2026-08-04.md §16). Afterward the slide is rinsed to remove non-specific binding (notes/dna-microarrays-2d-gel-electrophoresis-2026-08-04.md §16).
Step 6 — Scan and interpret.
The slide goes into a fluorescence scanner, which quantifies the color at each spot; it can image the red and green channels separately and merge the two images (notes/dna-microarrays-2d-gel-electrophoresis-2026-08-04.md §16; slides: Lecture 3 p.6). The color of each spot is the experiment's answer, one gene at a time:
- Red spot: more cancer-cell cDNA bound — the gene is more expressed in cancer cells (notes/dna-microarrays-2d-gel-electrophoresis-2026-08-04.md §16).
- Green spot: more normal-cell cDNA bound — the gene is more expressed in normal cells (notes/dna-microarrays-2d-gel-electrophoresis-2026-08-04.md §16).
- Yellow spot: approximately equal red and green — the gene is expressed equally in both cell types (notes/dna-microarrays-2d-gel-electrophoresis-2026-08-04.md §16).
- Black spot: no cDNA bound — the gene is not expressed in either cell type (notes/dna-microarrays-2d-gel-electrophoresis-2026-08-04.md §16).
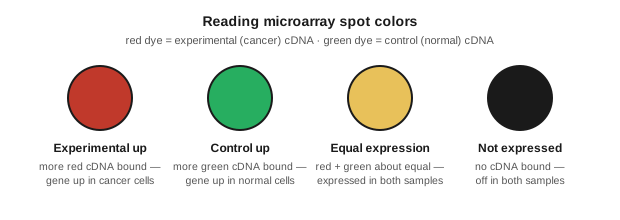
Lecture showed a real example from Lehninger: a yeast microarray where green spots were genes expressed during normal growth, red spots were genes expressed during spore formation, yellow spots were genes active in both conditions, and many black spots were unexpressed genes (notes/dna-microarrays-2d-gel-electrophoresis-2026-08-04.md §16; slides: Lecture 3 p.6).
Why this matters: the microarray shows all genes simultaneously — a major advantage over older approaches that isolated one thing at a time — and in a cancer study the red spots identify genes whose expression differs in cancer cells; not every one of those directly causes cancer, because one upstream gene can control many downstream targets (notes/dna-microarrays-2d-gel-electrophoresis-2026-08-04.md §16).
Final answer, plainly stated: the laboratory steps of a DNA microarray experiment are (1) isolate mRNA from control and experimental cells on an oligo-dT affinity column, (2) reverse-transcribe each mRNA population into cDNA with a fluorescent nucleotide — red for the experimental sample, green for the control, (3) destroy the mRNA template with NaOH and neutralize, (4) hybridize both cDNA populations competitively to a chip of single-stranded gene dots, (5) rinse and scan, and (6) read each spot: red = up in the experimental sample, green = up in the control, yellow = equal in both, black = expressed in neither (notes/dna-microarrays-2d-gel-electrophoresis-2026-08-04.md §9–§16).
Common pitfalls
- Thinking the chip measures proteins. A microarray reads mRNA only; the technique that surveys all of a cell's proteins is the 2D gel, and a microarray can even miss a single-base change that a 2D gel would catch as a charge shift in the encoded protein (notes/dna-microarrays-2d-gel-electrophoresis-2026-08-04.md §17).
- Swapping the colors. The color of a spot means nothing until you know which sample got which dye. In the lecture's convention, cancer cDNA is red and normal cDNA is green (notes/dna-microarrays-2d-gel-electrophoresis-2026-08-04.md §13) — so a red spot means the gene is up in cancer cells (notes/dna-microarrays-2d-gel-electrophoresis-2026-08-04.md §16). If the dyes had been assigned the other way, every interpretation would flip.
- Reading a black spot as a failed experiment. Black is data: it means the gene is not expressed in either cell type — the yeast example had many black spots (notes/dna-microarrays-2d-gel-electrophoresis-2026-08-04.md §16).
- Forgetting why the NaOH and HCl steps exist. Without destroying the mRNA template the cDNA is not single-stranded, and without neutralizing back to pH 7 the cDNA cannot form the hydrogen bonds that bind it to the chip — either omission means no hybridization signal (notes/dna-microarrays-2d-gel-electrophoresis-2026-08-04.md §14).
- Treating every red spot as a cancer-causing gene. A red spot marks a difference in expression, not a cause; one upstream gene can control many downstream targets (notes/dna-microarrays-2d-gel-electrophoresis-2026-08-04.md §16).
Check yourself
Check yourself (original practice — not from the course): You compare drought-stressed tomato leaves (experimental) with well-watered leaves (control). You label the drought cDNA green and the well-watered cDNA red — note this is the reverse of the lecture's color convention. After hybridization and scanning: gene X's spot is green, gene Y's spot is yellow, and gene Z's spot is black. What does each spot tell you?
Answer: Work from which sample carries which dye, not from the colors' usual meaning. Green is the drought sample here, so gene X is more expressed in drought-stressed leaves. Yellow means roughly equal amounts of red and green cDNA bound, so gene Y is expressed about equally under both conditions. Black means neither sample's cDNA bound, so gene Z is not expressed in either condition — a real result, not a failure.
Q2 — Microcalorimetry Experiment
What the question asks
A microcalorimetry experiment was run on spinach plants using the same three-part protocol taught in lecture. Some plants served as untreated "controls," and their leaves went into ampule #1; other plants were treated with a pesticide for several days, and their leaves went into ampule #2 (HW1 Q2). The protocol: in part A, 40 µL of water is placed in the ampule's interior well; in part B, 40 µL of 0.4 M NaOH replaces the water; in part C, 40 µL of water goes back in (HW1 Q2).
The given measurements (HW1 Q2):
- Ampule #1 (control): a heat rate of 75 µW/mg in part A, and a 20% increase in heat rate when the 0.4 M NaOH is added in part B.
- Ampule #2 (pesticide-treated, same mass of leaves): a 30% decrease in heat rate per mg in part A relative to ampule #1's part A, and the same heat rate per mg in part B as in its own part A.
You are asked to do three things: (1) make a graph with labeled axes and carefully draw ampule #1's results, including what part C should look like; (2) draw ampule #2's plot, including its part C; and (3) state what you conclude about the pesticide's effects on the metabolism of the spinach leaves (HW1 Q2).
What you need to know first
Nothing in this module comes from the shared primer — the microcalorimetry background is specific to this one question, so all of it is taught right here, in five short pieces.
1. Heat as a metabolic readout. Energy changes are an important part of metabolism (slides: Lecture 4 p.2). Microcalorimetry measures the flow of heat out of living cells: the cells stay alive for the whole experiment, unlike freshman-chemistry calorimetry, where a substance is burned to completion and the total heat released is measured (notes/microcalorimetry-and-glycolysis-intro-2026-08-05.md §2). The instrument reports only ΔH, the heat/enthalpy term of the Gibbs free energy equation ΔG = ΔH − TΔS (slides: Lecture 4 p.2; notes/microcalorimetry-and-glycolysis-intro-2026-08-05.md §2). The practical meaning: living tissue gives a real, nonzero heat signal — and if the signal levels off at zero, the cells are dead (notes/microcalorimetry-and-glycolysis-intro-2026-08-05.md §6).
2. The ampule and its interior well. The ampule is a small metal container about the size of a thumb, with a volume of roughly one milliliter, made of a special metal alloy that is excellent at transferring heat (notes/microcalorimetry-and-glycolysis-intro-2026-08-05.md §4). A small metal cylinder welded to the interior creates a well that holds about 40 µL of liquid; the tissue sits in the main chamber and must not contact the liquid in the well (notes/microcalorimetry-and-glycolysis-intro-2026-08-05.md §4). A metal lid screws on tightly, with thin tubing through a small hole connecting to a pressure sensor (notes/microcalorimetry-and-glycolysis-intro-2026-08-05.md §4). The instrument holds four ampule positions: one reference position (an empty ampule, never changed) and three sample positions, each surrounded in three dimensions by heat sensors that convert heat into electrical signals (notes/microcalorimetry-and-glycolysis-intro-2026-08-05.md §5). The lecture's own example experimental design is exactly this homework's setup: ampule 1 holding leaves of a normal plant, ampule 2 holding leaves of a pesticide-treated plant, to test whether the pesticide changes plant metabolism (notes/microcalorimetry-and-glycolysis-intro-2026-08-05.md §5).
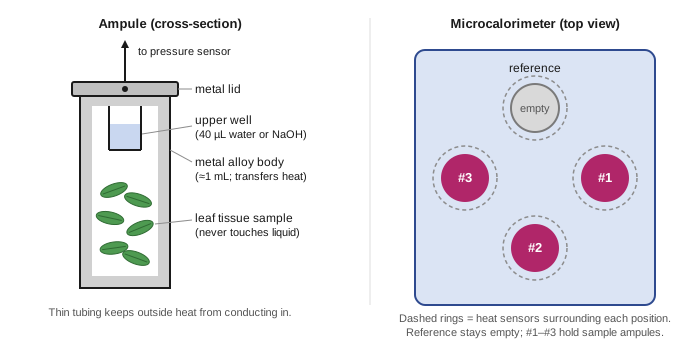
3. The three-part protocol and the shape of the trace. The results are plotted with microwatts — joules per second — per milligram of dry weight on the y-axis and time in minutes on the x-axis; the data are normalized to dry weight because the amount of tissue varies between ampules (notes/microcalorimetry-and-glycolysis-intro-2026-08-05.md §6). In part A, with 40 µL of water in the well, the signal is off-scale at first (room heat entered when the ampules were inserted), then falls and levels off; that plateau value is the heat flow from the living cells, and part A typically runs about 30 minutes (notes/microcalorimetry-and-glycolysis-intro-2026-08-05.md §6). In part B, the water is replaced with 40 µL of 0.4 M NaOH — a strong base, deliberately in excess — which sits in the upper well and never touches the tissue; after the instrument recovers, the signal levels off at a higher plateau than part A (notes/microcalorimetry-and-glycolysis-intro-2026-08-05.md §7). After part B (about 30 minutes), the NaOH is replaced with 40 µL of water for part C (notes/microcalorimetry-and-glycolysis-intro-2026-08-05.md §8). The lecture's plot template marks the time axis at 30, 60, and 90 minutes — one ~30-minute segment per part (slides: Lecture 4 p.4).
4. Why NaOH raises the measured heat. Cells produce a lot of CO₂, mostly from their mitochondria (notes/microcalorimetry-and-glycolysis-intro-2026-08-05.md §2). CO₂ is nonpolar and passes through cell membranes freely; inside the sealed ampule, the CO₂ molecules bounce around at high velocity (notes/microcalorimetry-and-glycolysis-intro-2026-08-05.md §7). When a CO₂ molecule hits the NaOH surface, it is chemically trapped: OH⁻ attacks the carbon of CO₂ (both oxygens pull electron density away from the carbon, leaving it partially positive), forming bicarbonate, and the excess OH⁻ then converts the bicarbonate to carbonate (notes/microcalorimetry-and-glycolysis-intro-2026-08-05.md §7).
CO2 + OH- --> bicarbonate --(excess OH-)--> carbonate [releases heat]
These trapping reactions are exothermic — each trapped CO₂ releases heat that the instrument detects — so the difference between the part B and part A plateaus is proportional to the tissue's CO₂ production rate (notes/microcalorimetry-and-glycolysis-intro-2026-08-05.md §7). The NaOH is in excess to ensure every CO₂ molecule is captured (notes/microcalorimetry-and-glycolysis-intro-2026-08-05.md §7). The key diagnostic for this problem: if part B levels off at the same value as part A, no detectable CO₂ is being produced, which for plant cells would indicate nonfunctional mitochondria (notes/microcalorimetry-and-glycolysis-intro-2026-08-05.md §7).
5. What part C is for. Part C is a control: the signal should return to approximately the part A baseline, and this verifies that nothing harmful happened during part B — for example, NaOH accidentally dripping onto the tissue would cause heat from cell destruction unrelated to CO₂ (notes/microcalorimetry-and-glycolysis-intro-2026-08-05.md §8). Without part C, one would have to assume part B caused no damage, which is undesirable in science (notes/microcalorimetry-and-glycolysis-intro-2026-08-05.md §8).
Step-by-step solution
Step 1 — Set up the graph. Label the y-axis "heat rate (µW/mg dry weight)" and the x-axis "time (min)" (notes/microcalorimetry-and-glycolysis-intro-2026-08-05.md §6). Divide the time axis into three ~30-minute segments — part A from 0 to 30 min, part B from 30 to 60 min, part C from 60 to 90 min — matching the lecture template's tick marks at 30, 60, and 90 minutes (slides: Lecture 4 p.4; notes/microcalorimetry-and-glycolysis-intro-2026-08-05.md §6, §8).
Step 2 — Ampule #1, part A. The plateau is given directly: draw a flat line at 75 µW/mg across part A (HW1 Q2).
Step 3 — Ampule #1, part B. The heat rate increases by 20% when the NaOH is added (HW1 Q2). Convert the percentage into an actual plateau value:
- increase = 0.20 × 75 µW/mg = 15 µW/mg
- part B plateau = 75 µW/mg + 15 µW/mg = 90 µW/mg
Draw the trace stepping up to a flat plateau at 90 µW/mg for part B. That extra 15 µW/mg is the heat released by the exothermic CO₂-trapping chemistry in the well, and it is proportional to the control tissue's CO₂ production rate (notes/microcalorimetry-and-glycolysis-intro-2026-08-05.md §7).
Step 4 — Ampule #1, part C. Water replaces the NaOH, so the CO₂-trapping heat disappears and the signal should return to approximately the part A baseline: ~75 µW/mg (notes/microcalorimetry-and-glycolysis-intro-2026-08-05.md §8). This return also confirms nothing harmful happened to the tissue during part B (notes/microcalorimetry-and-glycolysis-intro-2026-08-05.md §8).
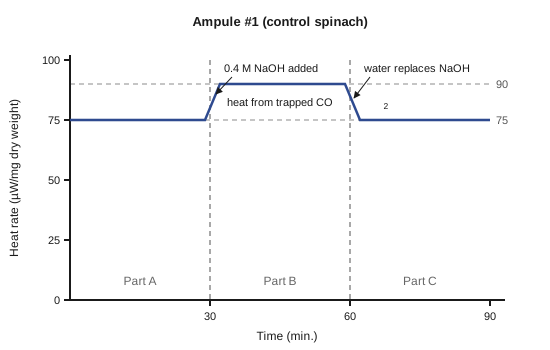
Step 5 — Ampule #2, part A. The pesticide-treated leaves show a 30% decrease in heat rate per mg relative to ampule #1's part A (HW1 Q2). Compute the plateau:
- decrease = 0.30 × 75 µW/mg = 22.5 µW/mg
- part A plateau = 75 µW/mg − 22.5 µW/mg = 52.5 µW/mg
Step 6 — Ampule #2, part B. Given: the part B heat rate is the same as ampule #2's own part A (HW1 Q2). The trace stays flat at 52.5 µW/mg — no step up when the NaOH goes in. A part B plateau equal to part A means no detectable CO₂ is being produced (notes/microcalorimetry-and-glycolysis-intro-2026-08-05.md §7).
Step 7 — Ampule #2, part C. Part C should return to approximately the part A baseline (notes/microcalorimetry-and-glycolysis-intro-2026-08-05.md §8) — and ampule #2's trace never left that baseline, so part C simply continues flat at ~52.5 µW/mg. The whole ampule #2 plot is one flat line at 52.5 µW/mg through all three parts.
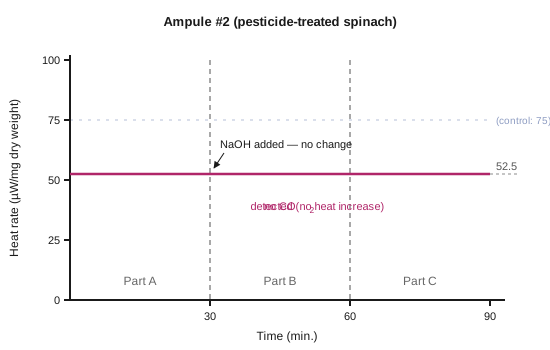
Step 8 — The conclusion (two parts, both required).
- The pesticide is reducing the overall metabolic heat rate of the plant — seen in part A, which is 30% lower than the control's — and that is not a good thing (Key HW1 p.2).
- Part B shows that CO₂ production has been reduced to non-detectable levels — the NaOH produced no rise at all — which is also not a good thing (Key HW1 p.2). For plant cells, no detectable CO₂ indicates nonfunctional mitochondria (notes/microcalorimetry-and-glycolysis-intro-2026-08-05.md §7), the organelles that produce most of a cell's CO₂ (notes/microcalorimetry-and-glycolysis-intro-2026-08-05.md §2).
Common pitfalls
- Plotting the percentages instead of computing the values. The axis carries µW/mg, so the 20% and 30% must be converted: 20% of 75 is 15 (plateau 90), 30% of 75 is 22.5 (plateau 52.5) (HW1 Q2 givens).
- Giving ampule #2 a part B rise "because NaOH always adds heat." The extra heat in part B is released only when a CO₂ molecule is actually trapped by the OH⁻; the A→B difference is proportional to CO₂ production, so no CO₂ means no rise (notes/microcalorimetry-and-glycolysis-intro-2026-08-05.md §7).
- Thinking the part B rise means the cells are metabolizing faster. The NaOH sits in the upper well and never touches the tissue; the added heat comes from the trapping chemistry in the well, not from a change in the cells (notes/microcalorimetry-and-glycolysis-intro-2026-08-05.md §7).
- Drawing part C at some new level. Part C is a control whose expected result is a return to approximately that ampule's own part A baseline; a failure to return would signal that something harmful (like NaOH dripping onto the tissue) happened during part B (notes/microcalorimetry-and-glycolysis-intro-2026-08-05.md §8).
- Stating only one conclusion. The key requires both observations: reduced overall heat rate (part A) and non-detectable CO₂ production (part B) (Key HW1 p.2).
Check yourself
Check yourself (original practice — not from the course): A third ampule of spinach leaves gives a part A plateau of 60 µW/mg and a part B plateau of 72 µW/mg. A classmate argues: "72 is a 20% increase over 60 — the same 20% the control showed — so this tissue must be producing CO₂ at the same rate as the control." Is the classmate right? And what should part C look like?
Answer: The classmate is wrong. CO₂ production rate is read from the absolute difference between the part B and part A plateaus, not the percentage. Third ampule: 72 − 60 = 12 µW/mg of trapping heat. Control: 90 − 75 = 15 µW/mg. Since 12 ÷ 15 = 0.8, the third tissue is producing CO₂ at only about 80% of the control's rate, even though the percentage increase happens to match. Part C should return to approximately 60 µW/mg — this ampule's own part A baseline — provided the tissue was not damaged during part B.
Q3a — Enzyme Kinetic Graph Axes
What the question asks
Question 3 opens a five-part story about one enzyme assay. A student is measuring the activity of lactate dehydrogenase (LDH), an enzyme of anaerobic glycolysis, by mixing a 1 mL reaction in a cuvette: 900 µL of 200 mM Tris buffer at pH 7.3, 35 µL of 30 mM pyruvate, 35 µL of 6.6 mM NADH, and 30 µL of an LDH solution that is itself in 200 mM Tris at pH 7.3 (HW1 p.2). The student then watches the absorbance at 340 nm in a spectrophotometer and records how it changes with time; the measured change was ΔA₃₄₀ = −0.0311 over 30 seconds (HW1 p.2).
Part (a) asks a warm-up question: on the enzyme kinetic graph, what quantity goes on the x-axis and what quantity goes on the y-axis? (HW1 Q3a)
What you need to know first
- Primer D teaches what an enzyme assay is, what initial velocity v₀ means, and the Michaelis–Menten model with its Vmax and Km.
- Primer C teaches why watching 340 nm is the same thing as watching NADH.
- Primer B teaches what absorbance is in the first place.
One question-specific idea is taught inline below: this experiment actually involves two different graphs, and the question is testing whether you can tell them apart.
Step-by-step solution
Step 1 — name the graph. "The enzyme kinetic graph" is the velocity-versus-substrate plot from Primer D: a plot of initial velocity v₀ against substrate concentration [S], which for a Michaelis–Menten enzyme is a hyperbola — velocity is zero at zero substrate, rises steeply at low [S], and plateaus as the enzyme saturates (notes/course-intro-metabolism-overview-2026-08-03.md §18). LDH itself is one of the Michaelis–Menten enzymes of glycolysis (notes/course-intro-metabolism-overview-2026-08-03.md §18), so this is exactly the graph its kinetics produce.
Step 2 — state the axes. The answer key defers to the lecture notes here ("Refer to your notes," Key HW1 p.2), and the notes give the plot directly (notes/course-intro-metabolism-overview-2026-08-03.md §18):
x-axis: substrate concentration [S]. y-axis: initial velocity v₀.
Step 3 — do not confuse it with the raw assay trace. The number the student actually recorded, ΔA₃₄₀ per 30 seconds, does not come from the enzyme kinetic graph. It comes from the raw assay trace: absorbance at 340 nm on the y-axis versus time on the x-axis. At time zero A₃₄₀ is high because NADH is present; if LDH is present the absorbance falls over time as NADH is consumed, and a flat line means no LDH at all (notes/glycolysis-energetics-glycogen-2026-08-10.md §19). Only the initial linear region of that falling curve — the Beer's-law region — may be used, and its slope is the initial velocity v₀ (notes/glycolysis-energetics-glycogen-2026-08-10.md §19).
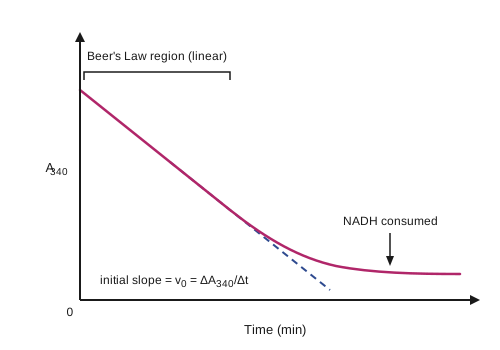
Step 4 — see how the two graphs connect. Each raw trace is run at one particular substrate concentration and yields one number: the v₀ for that [S] (notes/glycolysis-energetics-glycogen-2026-08-10.md §19). Repeating the assay at several different substrate concentrations gives several ([S], v₀) pairs, and plotting those pairs is what builds the enzyme kinetic graph — the hyperbola of v₀ versus [S] (notes/course-intro-metabolism-overview-2026-08-03.md §18). The hyperbola itself is drawn in Primer D; see the Michaelis–Menten figure there rather than here.
Common pitfalls
- Answering "A₃₄₀ and time." Those are the axes of the raw assay trace, the graph of one experiment — not the enzyme kinetic graph, which summarizes many experiments (notes/glycolysis-energetics-glycogen-2026-08-10.md §19; notes/course-intro-metabolism-overview-2026-08-03.md §18).
- Reading v₀ from anywhere on the raw trace. Only the initial linear region obeys Beer's law and gives a valid v₀ (notes/glycolysis-energetics-glycogen-2026-08-10.md §19).
- Swapping the axes. Velocity is the measured outcome, so v₀ goes on the y-axis; the concentration you chose goes on the x-axis (notes/course-intro-metabolism-overview-2026-08-03.md §18).
Check yourself
Check yourself (original practice — not from the course): You run five LDH assays, identical except that the pyruvate concentration differs in each, and from each raw trace you measure the initial slope ΔA₃₄₀/Δt. Describe, step by step, how you would turn these five measurements into an enzyme kinetic graph.
Answer: Each raw trace gives one initial velocity: take the slope of its initial linear region as the v₀ for that assay. You now have five ([S], v₀) pairs — one per pyruvate concentration. Plot pyruvate concentration [S] on the x-axis and v₀ on the y-axis; the five points trace out the rising-then-plateauing hyperbola of a Michaelis–Menten enzyme.
Q3b — Interpreting the Negative ΔA₃₄₀
What the question asks
The student's measured value was ΔA₃₄₀/30 s = −0.0311 (HW1 p.2). Part (b) asks: what information does the minus sign carry? (HW1 Q3b)
What you need to know first
- Primer B — absorbance is directly proportional to the concentration of the absorbing molecule (Beer's law), so a change in absorbance means a change in concentration.
- Primer C — which molecule in this cuvette absorbs at 340 nm, and what the LDH reaction does to it.
No new concepts are needed inline; this question is a pure chain of three facts you already have.
Step-by-step solution
Step 1 — only NADH is visible at 340 nm. NADH absorbs light at 340 nm; NAD⁺ does not absorb at 340 nm, and biochemists set the spectrophotometer to 340 nm precisely because buffer, proteins, NAD⁺, and the other substrates do not absorb there (notes/glycolysis-energetics-glycogen-2026-08-10.md §12). So A₃₄₀ is, in effect, a live readout of the NADH concentration.
Step 2 — the reaction destroys NADH. The reaction being assayed is (notes/course-intro-metabolism-overview-2026-08-03.md §15):
pyruvate + NADH + H+ --[LDH]--> L-lactate + NAD+
Every turnover converts one NADH (absorbs at 340 nm) into one NAD⁺ (does not absorb at 340 nm) (notes/glycolysis-energetics-glycogen-2026-08-10.md §12).
Step 3 — falling concentration means falling absorbance. By Beer's law, absorbance is proportional to concentration (Primer B; notes/glycolysis-energetics-glycogen-2026-08-10.md §17). As LDH consumes NADH, [NADH] falls, so A₃₄₀ falls over time (notes/glycolysis-energetics-glycogen-2026-08-10.md §19). A quantity that falls over time has a negative change: ΔA₃₄₀ = (later absorbance) − (earlier absorbance) < 0.
Answer: the minus sign tells you that the compound you are measuring — NADH — is being consumed (Key HW1 p.2). The reaction is running in the pyruvate → lactate direction, eating NADH and making the invisible-at-340-nm NAD⁺.
Common pitfalls
- Treating the minus sign as an error or as "negative enzyme activity." It is real data: the direction of the absorbance change reports the direction of the chemistry. Activity itself is reported as a positive number even though the absorbance change is negative (notes/glycolysis-energetics-glycogen-2026-08-10.md §20) — that becomes important in Q3c.
- Forgetting which species absorbs. If you misremember NAD⁺ as the absorber, you would read this trace exactly backwards. Only NADH absorbs at 340 nm (notes/glycolysis-energetics-glycogen-2026-08-10.md §12).
Check yourself
Check yourself (original practice — not from the course): Suppose you loaded a cuvette to run the reverse reaction — lactate and NAD⁺ as the starting materials, so the enzyme runs L-lactate + NAD+ --[LDH]--> pyruvate + NADH + H+. Would the measured ΔA₃₄₀/Δt be positive or negative, and why?
Answer: Positive. Now the reaction produces NADH, the only species in the cuvette that absorbs at 340 nm, so [NADH] rises with time and A₃₄₀ rises with it — a positive slope instead of a negative one.
Q3c — Calculating International Units of LDH
What the question asks
Part (c) asks how many international units (I.U.) of LDH were present in the assay, given the measured rate ΔA₃₄₀/30 s = −0.0311 from the 1 mL assay (HW1 p.2) and the molar extinction coefficient of NADH at 340 nm, ε = 6220 M⁻¹cm⁻¹ (HW1 Q3c).
What you need to know first
- Primer B — Beer's law, A = ε·l·c, and what each symbol means. We will run it backwards: from an absorbance change to a concentration change.
- Primer C — why the absorbance change at 340 nm counts NADH molecules specifically.
Two question-specific facts, taught inline:
- What an international unit is. Enzyme amounts are reported by what the enzyme does: converting the measured rate into micromoles of substrate consumed (or product formed) per minute gives the number of IUs of active enzyme in the cuvette — for example, 0.15 µmol of NADH consumed per minute is 0.15 IU of active LDH (notes/glycolysis-energetics-glycogen-2026-08-10.md §20). One IU therefore corresponds to 1 µmol converted per minute. Although the NADH absorbance change is negative (NADH is being consumed), IUs are reported as a positive number (notes/glycolysis-energetics-glycogen-2026-08-10.md §20).
- Path length. The l in Beer's law is the distance the light travels through the cuvette; the standard value is 1 cm (notes/glycolysis-energetics-glycogen-2026-08-10.md §17). The homework does not restate it, so we use the standard 1 cm.
One more link makes the units meaningful: the LDH reaction consumes exactly one NADH per pyruvate converted (pyruvate + NADH + H+ --[LDH]--> L-lactate + NAD+, notes/course-intro-metabolism-overview-2026-08-03.md §15), so counting NADH consumed per minute is counting substrate converted per minute.
Step-by-step solution
The plan follows the lecture's recipe: measure ΔA per unit time from the linear region, convert to a per-minute change, use Beer's law to get the concentration change per minute, multiply by the assay volume in liters to get moles per minute, and convert to micromoles — that number is the IUs (notes/glycolysis-energetics-glycogen-2026-08-10.md §20). Units are carried through every step; guessing whether to multiply or divide is how errors happen (notes/glycolysis-energetics-glycogen-2026-08-10.md §20).
Step 1 — convert the rate to a per-minute basis. The measurement window was 30 seconds. One minute is 60 seconds, and 60 s ÷ 30 s = 2, so a full minute holds two of these windows:
ΔA₃₄₀ per minute = −0.0311 × 2 = −0.0622 per minute.
Since IUs are reported as positive numbers (notes/glycolysis-energetics-glycogen-2026-08-10.md §20), carry the magnitude forward: 0.0622 per minute.
Step 2 — Beer's law, solved for concentration. Beer's law is A = ε·l·c (notes/glycolysis-energetics-glycogen-2026-08-10.md §17). The same proportionality applies to changes: ΔA = ε·l·Δc. Divide both sides by ε·l:
Δc = ΔA ÷ (ε · l) = 0.0622 min⁻¹ ÷ (6220 M⁻¹cm⁻¹ × 1 cm)
Do the division digit by digit: 0.0622 ÷ 6220 = 0.00001 = 1.0 × 10⁻⁵. Check the units: M⁻¹cm⁻¹ × cm = M⁻¹, and dividing by M⁻¹ is multiplying by M. So:
Δc = 1.0 × 10⁻⁵ M of NADH consumed per minute.
(Sanity check by multiplying back: 6220 × 1.0 × 10⁻⁵ = 0.0622. ✓)
Step 3 — convert molar to micromolar. 1 mol = 10⁶ µmol, so:
1.0 × 10⁻⁵ mol/L per min × 10⁶ µmol/mol = 1.0 × 10¹ µmol/L per min = 10 µmol per liter per minute (10 µM/min).
Step 4 — multiply by the assay volume. Concentration is per liter, but the cuvette holds only 1 mL (HW1 p.2). Convert: 1 mL × (1 L ÷ 1000 mL) = 0.001 L. Multiplying by the volume in liters cancels the "per liter" (notes/glycolysis-energetics-glycogen-2026-08-10.md §20):
10 µmol L⁻¹ min⁻¹ × 0.001 L = 0.01 µmol per minute.
Step 5 — read off the IUs. NADH is consumed 1:1 with pyruvate (notes/course-intro-metabolism-overview-2026-08-03.md §15), so 0.01 µmol of NADH consumed per minute is 0.01 µmol of substrate converted per minute, and micromoles per minute is the IU count (notes/glycolysis-energetics-glycogen-2026-08-10.md §20):
The assay contained 0.01 I.U. of LDH (Key HW1 p.2).
Common pitfalls
- Skipping the time conversion. The rate was measured over 30 s but IUs are per minute (notes/glycolysis-energetics-glycogen-2026-08-10.md §20); forgetting the ×2 gives 0.005 IU, off by a factor of two. (The lecture example used a 15-second window and multiplied by 4 for the same reason — notes/glycolysis-energetics-glycogen-2026-08-10.md §20.)
- Skipping the volume step. 10 µmol/L/min is a concentration rate; the cuvette contains only 0.001 L of it. Answering 10 IU instead of 0.01 IU is a 1000-fold error (notes/glycolysis-energetics-glycogen-2026-08-10.md §20).
- Reporting −0.01 IU. The minus sign belongs to the absorbance trace, which falls as NADH is consumed; the enzyme amount is reported positive (notes/glycolysis-energetics-glycogen-2026-08-10.md §20).
- Dropping units mid-calculation. Carrying M⁻¹cm⁻¹ through Step 2 is exactly what tells you to divide rather than multiply (notes/glycolysis-energetics-glycogen-2026-08-10.md §20).
Check yourself
Check yourself (original practice — not from the course): A different LDH assay gives ΔA₃₄₀/15 s = −0.0200 in a 3 mL reaction (1 cm cuvette, ε = 6220 M⁻¹cm⁻¹). How many IU of LDH are in the assay?
Answer: Per minute: 60 ÷ 15 = 4, so |ΔA₃₄₀|/min = 0.0200 × 4 = 0.0800. Beer's law: Δc = 0.0800 ÷ (6220 × 1) = 1.286 × 10⁻⁵ M/min = 12.86 µmol/L/min. Volume: 3 mL = 0.003 L, so 12.86 × 0.003 = 0.0386 µmol/min ≈ 0.039 IU.
Q3d — Did the pH Change During the Assay?
What the question asks
Part (d) says: suppose the whole LDH assay ran for 2 minutes; did the pH of the assay change much in that time? Show a calculation, given that the pKa of Tris is 8.21 (HW1 Q3d). The buffer in the cuvette is Tris at pH 7.3, supplied as 900 µL of a 200 mM stock in the 1 mL assay (HW1 p.2), and the reaction rate is the 0.01 µmol/min we just calculated in Q3c.
What you need to know first
- Primer A — what a buffer is, what pKa means, and the Henderson–Hasselbalch equation, pH = pKa + log([B]/[A]) (notes/course-intro-metabolism-overview-2026-08-03.md §14).
Three question-specific ideas, taught inline:
1. The Tris buffer system. Tris is a man-made buffer: three CH₂OH groups on a central carbon plus one amino group; only the amino group's proton dissociates, so Tris has a single pKa of about 8.2 (notes/course-intro-metabolism-overview-2026-08-03.md §17) — the homework's exact value is 8.21 (HW1 Q3d). The acid form, TrisH⁺ (protonated amino group), carries a +1 charge; the base form, Tris, is neutral (notes/course-intro-metabolism-overview-2026-08-03.md §17). Throughout this module, A = TrisH⁺ (the acid form) and B = Tris (the base form).
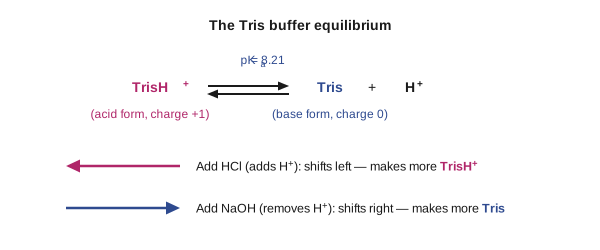
2. This reaction removes protons. The LDH reaction consumes an H⁺ — when it runs in the pyruvate-to-lactate direction, a proton is incorporated into lactate, which would raise the pH if not for the buffer (notes/course-intro-metabolism-overview-2026-08-03.md §15). When protons are removed from a buffered solution, the buffer's acid form donates protons to compensate (notes/course-intro-metabolism-overview-2026-08-03.md §14): TrisH⁺ dissociates to replace each consumed H⁺, so [A] falls and [B] rises by the amount consumed.
3. The two-equation strategy. This is the calculation pattern the homework points to in Segel #40–41 (HW1 Q3d), and the key confirms it: use two Henderson–Hasselbalch equations (Key HW1 p.2). Equation 1 gives the buffer's [B] and [A] at time zero; equation 2 recomputes the pH after shifting [A] and [B] by the amount of H⁺ the reaction consumed.
Step-by-step solution
Step 0 — how much Tris is actually in the cuvette? The stock is 200 mM, but only 900 µL of it went into the 1000 µL assay (HW1 p.2), so it got diluted. Moles first: 0.200 mmol/mL × 0.900 mL = 0.180 mmol of Tris. That 0.180 mmol now sits in 1.000 mL, so the concentration is 0.180 mmol ÷ 0.001 L = 180 mM total Tris. (The 30 µL of LDH solution is also in 200 mM Tris (HW1 p.2), which would add 0.200 × 0.030 = 0.006 mmol more, giving 186 mM; we use the simpler 180 mM, which slightly understates the buffer and so can only make our "did it change?" test stricter.)
Step 1 — first Henderson–Hasselbalch: speciate the buffer at time zero. The equation is pH = pKa + log([B]/[A]) (notes/course-intro-metabolism-overview-2026-08-03.md §14). Insert the knowns, pH 7.3 and pKa 8.21:
7.3 = 8.21 + log([B]/[A])
Subtract 8.21 from both sides:
log([B]/[A]) = 7.3 − 8.21 = −0.91
Undo the log by raising 10 to both sides:
[B]/[A] = 10⁻⁰·⁹¹ = 0.123
So there is about 0.123 molecule of base for every 1 molecule of acid. That direction makes sense: the pH (7.3) is below the pKa (8.21), and a buffer is mostly in its base form only when the pH is well above the pKa (notes/course-intro-metabolism-overview-2026-08-03.md §14) — here we are below, so Tris is mostly acid form.
Now split the 180 mM total between the two forms. The two unknowns satisfy:
[A] + [B] = 180 mM and [B] = 0.123 × [A]
Substitute the second into the first:
[A] + 0.123·[A] = 180 → 1.123·[A] = 180 → [A] = 180 ÷ 1.123 = 160.28 mM
[B] = 180 − 160.28 = 19.72 mM
So at time zero: [TrisH⁺] = [A] ≈ 160.3 mM and [Tris] = [B] ≈ 19.7 mM. (Check: 19.72 ÷ 160.28 = 0.123. ✓)
Step 2 — how much H⁺ does the reaction consume in 2 minutes? From Q3c, the assay converts 0.01 µmol of substrate per minute, and the reaction consumes one H⁺ per turnover (pyruvate + NADH + H+ --[LDH]--> L-lactate + NAD+, notes/course-intro-metabolism-overview-2026-08-03.md §15). Over the 2-minute assay (HW1 Q3d):
0.01 µmol/min × 2 min = 0.02 µmol of H⁺ consumed.
Convert to a concentration in the 1 mL (0.001 L) cuvette:
0.02 µmol ÷ 0.001 L = 20 µmol/L = 0.02 mmol/L = 0.02 mM.
(Feasibility check: the cuvette holds 0.035 mL × 6.6 mM = 0.231 µmol of NADH (HW1 p.2), so consuming 0.02 µmol uses under a tenth of the supply — the reaction really can run for the full 2 minutes.)
Step 3 — second Henderson–Hasselbalch: recompute the pH. Removing H⁺ makes the acid form donate protons (notes/course-intro-metabolism-overview-2026-08-03.md §14): every replaced proton turns one TrisH⁺ into one Tris. So with x = 0.02 mM:
new [A] = 160.28 − 0.02 = 160.26 mM new [B] = 19.72 + 0.02 = 19.74 mM
new pH = 8.21 + log(19.74 ÷ 160.26)
Divide: 19.74 ÷ 160.26 = 0.12317. Take the log: log(0.12317) = −0.9095. So:
new pH = 8.21 − 0.9095 = 7.3005
Answer: No — the pH did not change much; it remained at 7.3 (Key HW1 p.2). Carrying full digits, the pH drifted from 7.3000 to about 7.3005, a rise of roughly 0.0005 pH units. The reason is the mismatch in scale: the reaction consumed 0.02 mM of H⁺, while the buffer holds a 160.3 mM reservoir of proton-donating TrisH⁺ — the reaction touched about one part in 8000 of it (0.02 ÷ 160.28 ≈ 0.012%).
Common pitfalls
- Shifting [A] and [B] the wrong way. This reaction consumes H⁺, so the acid form shrinks and the base form grows (notes/course-intro-metabolism-overview-2026-08-03.md §14), and the pH creeps up. (Contrast the proton-adding case: then the new [B] decreases by the protons added and [A] increases — notes/course-intro-metabolism-overview-2026-08-03.md §14.)
- Forgetting the dilution. The cuvette does not contain 200 mM Tris; it contains 900 µL of 200 mM stock in a 1 mL total (HW1 p.2), i.e., 180 mM.
- Expecting drama. A student who skips the numbers often guesses that 2 minutes of reaction must move the pH noticeably. The whole point of a high-molarity buffer is that it does not (notes/course-intro-metabolism-overview-2026-08-03.md §14).
- Using one equation instead of two. The homework's model problems and the key both call for two Henderson–Hasselbalch passes — one to speciate at time zero, one to re-solve for pH afterwards (HW1 Q3d; Key HW1 p.2).
Check yourself
Check yourself (original practice — not from the course): Same assay, same 2 minutes, but the student mistakenly made the buffer stock 2 mM Tris instead of 200 mM (still 900 µL in a 1 mL assay, still pH 7.3, pKa 8.21). Does the pH change matter now?
Answer: Total Tris = 2 mM × 0.9 = 1.8 mM; speciation at pH 7.3 gives [A] = 1.8 ÷ 1.123 = 1.603 mM and [B] = 0.197 mM. Consuming the same 0.02 mM of H⁺: [A] = 1.583 mM, [B] = 0.217 mM, so pH = 8.21 + log(0.217 ÷ 1.583) = 8.21 + log(0.1371) = 8.21 − 0.863 = 7.347. The pH climbs from 7.300 to about 7.347 in just 2 minutes — roughly 100 times the drift of the real assay, and it keeps drifting as the reaction runs. At 1/100 the molarity, the buffer stops doing its job.
Q3e — Three Ways to Minimize pH Change
What the question asks
Part (e) asks: if the pH had changed in part (d), what could you do to minimize the pH change? The homework wants three different answers (HW1 Q3e).
What you need to know first
- Primer A — buffer capacity and the Henderson–Hasselbalch equation.
- Q3d — where the numbers below come from: the reaction consumes H⁺ at 0.01 µmol/min, and the buffer resists with its 160.3 mM pool of acid-form TrisH⁺.
The organizing idea, inline: the pH drift is a contest between how much H⁺ the reaction consumes and how much the buffer can replace. Every valid answer attacks one side of that contest. The lecture's checklist for an effective buffer names the same levers: high molarity, a pKa near the desired pH, an appropriate base-to-acid ratio for the reaction at hand, and non-interference (notes/course-intro-metabolism-overview-2026-08-03.md §14).
Step-by-step solution
Answer 1 — run the assay for a shorter period of time (Key HW1 p.2). The total H⁺ consumed is rate × time: in Q3d it was 0.01 µmol/min × 2 min = 0.02 µmol. Cut the assay to 1 minute and only 0.01 µmol of H⁺ is consumed — half the disturbance for the buffer to absorb. Shrink the numerator of the contest.
Answer 2 — use a higher-molarity buffer (Key HW1 p.2). High molarity is the first requirement of an effective buffer — one or two molecules cannot control pH, and research buffers are typically 50 mM or higher (notes/course-intro-metabolism-overview-2026-08-03.md §14). Doubling the Tris from 180 mM to 360 mM in the cuvette would double both pools ([A] ≈ 320.6 mM, [B] ≈ 39.4 mM at the same 0.123 ratio), so the same 0.02 mM of consumed H⁺ becomes an even smaller fraction of the reservoir. Grow the denominator. (The Q3d check-yourself shows the reverse: at 1.8 mM total, the same reaction moves the pH about 100 times as far.)
Answer 3 — use a buffer with a pKa such that there is more acid form than base form ("more a than b") at time zero (Key HW1 p.2). This answer is matched to the direction of this reaction. LDH consumes H⁺ (notes/course-intro-metabolism-overview-2026-08-03.md §15), and when protons are removed it is the acid form that donates replacements (notes/course-intro-metabolism-overview-2026-08-03.md §14) — so the acid form is the reservoir that matters, and you want to start with plenty of it. The Henderson–Hasselbalch equation tells you how to get that with pKa choice: pH = pKa + log([B]/[A]) (notes/course-intro-metabolism-overview-2026-08-03.md §14), so whenever the assay pH sits below the buffer's pKa, the log term is negative and acid form predominates. This is the mirror image of the lecture's rule for proton-producing reactions, which need more base form B, because only B can absorb an incoming proton (notes/course-intro-metabolism-overview-2026-08-03.md §14).
Notice that the real assay already follows Answer 3: Tris at pH 7.3 with pKa 8.21 gave [A] : [B] ≈ 160.3 : 19.7, roughly 8 : 1 in favor of the proton donor (Q3d Step 1) — one more reason the pH barely moved. For how capacity behaves as pH moves relative to pKa, see the buffer-capacity figure in Primer A.
The three answers, fully visible (Key HW1 p.2): (1) run the assay for a shorter time; (2) use a higher-molarity buffer; (3) choose a buffer whose pKa gives more acid form than base form at time zero.
Common pitfalls
- Vague answers. "Use a better buffer" earns nothing; each answer must name a lever — time, molarity, or the pKa-set speciation — and each lever traces to the Henderson–Hasselbalch bookkeeping of Q3d.
- Reciting "more B than A" on reflex. That rule is for reactions that produce protons, where only B can absorb the incoming H⁺ (notes/course-intro-metabolism-overview-2026-08-03.md §14). This reaction consumes protons, so the key's answer wants the opposite: more A than B at time zero (Key HW1 p.2). Always check the reaction's direction first.
- Forgetting the fourth constraint. Whatever buffer you pick must also be non-interfering — it must not activate or inhibit the enzyme or absorb light at the detection wavelength (notes/course-intro-metabolism-overview-2026-08-03.md §14). That consideration returns in force in Q3g.
Check yourself
Check yourself (original practice — not from the course): You switch to assaying a different enzyme whose reaction produces one H⁺ per turnover. Which form of the buffer do you now want in excess at time zero — and is Tris at pH 7.3 (pKa 8.21) still a good match?
Answer: You now want more base form than acid form, because only the base form can absorb the incoming protons. Tris at pH 7.3 is a poor match: pH sits 0.91 units below the pKa, so the mix is about 8 parts acid to 1 part base — almost all of the buffer is useless against added H⁺. Pick a buffer whose pKa is at or below the assay pH so the base form predominates (and keep Answers 1 and 2 in reserve: shorter assays and higher molarity help in every direction).
Q3f — Preparing 500 mL of 200 mM Tris Buffer at pH 7.3
What the question asks
You need to prepare 500 mL of 200 mM Tris buffer at pH 7.3 for your LDH assays (HW1 Q3f). The lab has four reagents on the shelf: 1.0 M Tris solution at pH 9, 1.0 M HCl, 2.0 M NaOH, and water (HW1 Q3f). The task is to determine which reagents to use and how much of each, producing a recipe that gives the correct concentration, correct pH, and correct final volume. Not all four reagents need to be used (HW1 Q3f).
What you need to know first
This module builds on the Henderson-Hasselbalch equation taught in Primer A. You will also need the following question-specific concepts:
The Tris buffer system. Tris is a man-made buffer compound whose full name comes from its three CH₂OH groups attached to a central carbon; a single amino group (--NH₂) on the same carbon provides the ionizable proton (notes/course-intro-metabolism-overview-2026-08-03.md §17). Unlike phosphate, Tris has only one pKa because only the amino group can gain or lose a proton (notes/course-intro-metabolism-overview-2026-08-03.md §17). The two forms are:
- Acid form (TrisH⁺): The amino group is protonated (--NH₃⁺). The molecule carries a +1 charge (notes/course-intro-metabolism-overview-2026-08-03.md §17).
- Base form (Tris): The amino group has a lone pair (--NH₂). The molecule is electrically neutral (notes/course-intro-metabolism-overview-2026-08-03.md §17).
- pKa = 8.21 (HW1 Q3d).
The equilibrium is:
TrisH⁺ ⇌ Tris + H⁺
(See the Tris equilibrium diagram in Q3d for a visual of this protonation/deprotonation.)
Direction of adjustment. The stock Tris solution sits at pH 9, which is above the pKa of 8.21, so it is mostly in the base form (notes/course-intro-metabolism-overview-2026-08-03.md §17). The target pH of 7.3 is below the pKa, so the final buffer must be mostly in the acid form. To shift from mostly base to mostly acid, you add a strong acid (HCl), which donates protons and converts base form into acid form (notes/course-intro-metabolism-overview-2026-08-03.md §17). Adding NaOH would push the pH further up, not down -- NaOH is a distractor here and is not used (Key HW1 p.2).
Step-by-step solution
Step 1 — Calculate the total moles of Tris needed.
The final buffer must be 200 mM in a volume of 500 mL (HW1 Q3f):
moles Tris = concentration x volume moles Tris = 0.200 mol/L x 0.500 L = 0.100 mol
The stock is 1.0 M Tris, so the volume needed is:
volume = moles / concentration = 0.100 mol / 1.0 mol/L = 0.100 L = 100 mL of 1.0 M Tris stock
Step 2 — Speciate the stock at its starting pH (pH 9.0).
The Henderson-Hasselbalch equation gives the ratio of base to acid at pH 9.0 (notes/course-intro-metabolism-overview-2026-08-03.md §17):
pH = pKa + log([B]/[A]) 9.00 = 8.21 + log([B]/[A]) log([B]/[A]) = 9.00 - 8.21 = 0.79 [B]/[A] = 10^0.79 = 6.17
This means at pH 9, there are 6.17 mol of base for every 1 mol of acid. A quick sanity check: pH 9 is above the pKa of 8.21, so the base form should dominate -- and it does (notes/course-intro-metabolism-overview-2026-08-03.md §14).
Now distribute the 0.100 mol total Tris between the two forms:
[A] + [B] = 0.100 mol [B] = 6.17 x [A] 6.17[A] + [A] = 0.100 7.17[A] = 0.100 [A]_initial = 0.100 / 7.17 = 0.01395 mol (acid form) [B]_initial = 0.100 - 0.01395 = 0.08605 mol (base form)
Step 3 — Speciate at the target pH (pH 7.3).
The Henderson-Hasselbalch equation at the target pH (HW1 Q3f; Key HW1 p.2):
pH = pKa + log([B]/[A]) 7.3 = 8.21 + log([B]/[A]) log([B]/[A]) = 7.3 - 8.21 = -0.91 [B]/[A] = 10^(-0.91) = 0.123
Sanity check: pH 7.3 is below the pKa of 8.21, so the acid form should dominate -- and it does ([B]/[A] < 1) (notes/course-intro-metabolism-overview-2026-08-03.md §14).
Now distribute the same 0.100 mol total Tris at the target pH:
[A] + [B] = 0.100 mol [B] = 0.123 x [A] 0.123[A] + [A] = 0.100 1.123[A] = 0.100 [A]_final = 0.100 / 1.123 = 0.08905 mol (acid form) [B]_final = 0.100 - 0.08905 = 0.01095 mol (base form)
Step 4 — Calculate the moles of HCl needed.
Each mole of HCl donates one proton that converts one mole of base form (Tris) into acid form (TrisH⁺) (notes/course-intro-metabolism-overview-2026-08-03.md §14). The amount of HCl equals the increase in acid form:
moles HCl = [A]_final - [A]_initial moles HCl = 0.08905 - 0.01395 = 0.07510 mol
The available HCl is 1.0 M (HW1 Q3f):
volume HCl = 0.07510 mol / 1.0 mol/L = 0.0751 L = 75.1 mL, rounded to 75 mL
(In practice you would add approximately 75 mL and fine-tune with a pH meter.)
Step 5 — Calculate the volume of water.
water = 500 mL - 100 mL (Tris stock) - 75 mL (HCl) = 325 mL
Final recipe (Key HW1 p.2):
100 mL of 1.0 M Tris (pH 9) + 75 mL of 1.0 M HCl + 325 mL of water = 500 mL of 200 mM Tris buffer at pH 7.3
The 2.0 M NaOH is not used. Adding NaOH to a solution that already needs to come down in pH would be counterproductive (Key HW1 p.2).
Common pitfalls
- Using NaOH instead of HCl. The stock is at pH 9 and the target is pH 7.3 -- pH must go down, so you add acid, not base. The NaOH is a deliberate distractor in this problem (Key HW1 p.2).
- Forgetting that the stock is at pH 9, not pure base. The stock already contains some acid form (0.01395 mol out of 0.100 mol). If you assumed the stock were 100% base, you would calculate 0.08905 mol HCl instead of 0.07510 mol -- an overestimate of about 19%.
- Losing track of total moles. The total Tris is always 0.100 mol. Adding HCl converts base to acid but does not add or remove Tris. Only the ratio between the forms changes.
- Forgetting to include water. Without water, the volume would be only 175 mL. The concentration would be 0.100 mol / 0.175 L = 571 mM -- nearly three times too high.
Check yourself
Check yourself (original practice -- not from the course): Prepare 1.0 L of 100 mM Tris buffer at pH 8.0 from the same reagents (1.0 M Tris at pH 9, 1.0 M HCl, 2.0 M NaOH, water). Which reagent is not needed? What volumes do you use?
Answer: NaOH is again not needed (target pH is below stock pH). Total Tris = 0.100 mol/L x 1.0 L = 0.100 mol, so 100 mL of 1.0 M stock. Stock at pH 9: [B]/[A] = 10^(0.79) = 6.17, so [A]_initial = 0.100/7.17 = 0.01395 mol. Target pH 8.0: [B]/[A] = 10^(8.0 - 8.21) = 10^(-0.21) = 0.617, so [A]_final = 0.100/1.617 = 0.06184 mol. HCl = 0.06184 - 0.01395 = 0.04789 mol = 47.9 mL of 1.0 M HCl. Water = 1000 - 100 - 47.9 = 852.1 mL. Recipe: 100 mL stock + 48 mL HCl + 852 mL water.
Q3g — Phosphate Buffer Preparation and Buffer Choice
What the question asks
There are two parts to this question. First, you need to prepare 500 mL of 200 mM phosphate buffer at pH 7.3, starting from 1.0 M H₃PO₄ (phosphoric acid), 2.0 M NaOH, and water (HW1 Q3g). The pKa values of phosphoric acid are 2.12, 7.21, and 12.32 (HW1 Q3g). Second, once you have both a Tris buffer (from Q3f) and a phosphate buffer at pH 7.3, you need to explain how you would decide which one to use for your future LDH assays (HW1 Q3g).
What you need to know first
This module builds on the Henderson-Hasselbalch equation taught in Primer A and the buffer-preparation logic developed in Q3f. You will also need the following question-specific concept:
Phosphoric acid is triprotic. Unlike Tris (which has one pKa), phosphoric acid can lose three protons in sequence, producing four different species (slides: Lecture 2 p.4):
H₃PO₄ ⇌ H₂PO₄⁻ ⇌ HPO₄²⁻ ⇌ PO₄³⁻
Each arrow represents one deprotonation, and each has its own pKa (HW1 Q3g):
| Equilibrium | pKa | Acid form | Base form |
|---|---|---|---|
| First deprotonation | 2.12 | H₃PO₄ | H₂PO₄⁻ |
| Second deprotonation | 7.21 | H₂PO₄⁻ | HPO₄²⁻ |
| Third deprotonation | 12.32 | HPO₄²⁻ | PO₄³⁻ |
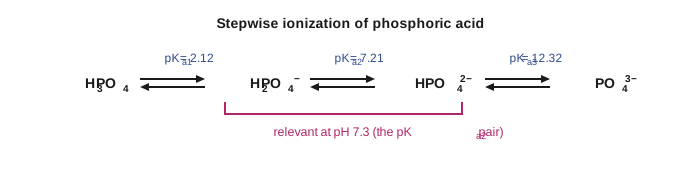
Choosing the relevant pKa. A buffer works best when the pH is within about one unit of the pKa (notes/course-intro-metabolism-overview-2026-08-03.md §14). The target pH of 7.3 is very close to pKa₂ = 7.21 (only 0.09 units away), far from pKa₁ = 2.12 or pKa₃ = 12.32 (HW1 Q3g). Therefore the relevant acid/base pair is H₂PO₄⁻ (acid) and HPO₄²⁻ (base), governed by pKa₂ = 7.21 (notes/course-intro-metabolism-overview-2026-08-03.md §16).
Starting from H₃PO₄ means extra NaOH is needed. The reagent is H₃PO₄, which is the fully protonated form. Before you can reach the pKa₂ buffering region, you must first add enough NaOH to convert all H₃PO₄ into H₂PO₄⁻ -- that is one full equivalent of NaOH per mole of phosphate. Only then can you add additional NaOH to partially convert H₂PO₄⁻ into HPO₄²⁻ to reach pH 7.3 (notes/course-intro-metabolism-overview-2026-08-03.md §16).
Step-by-step solution
Step 1 — Calculate total moles of phosphate and the volume of H₃PO₄ stock.
moles phosphate = 0.200 mol/L x 0.500 L = 0.100 mol volume of 1.0 M H₃PO₄ = 0.100 mol / 1.0 mol/L = 0.100 L = 100 mL
(HW1 Q3g; Key HW1 p.2)
Step 2 — Add the first full equivalent of NaOH to convert H₃PO₄ entirely to H₂PO₄⁻.
Each mole of NaOH removes one proton. Adding one mole of NaOH per mole of H₃PO₄ removes the first proton completely (notes/course-intro-metabolism-overview-2026-08-03.md §16):
H₃PO₄ + NaOH --> H₂PO₄⁻ + Na⁺ + H₂O
This reaction goes to completion because pKa₁ = 2.12 is far below the target pH of 7.3 -- at pH 7.3, essentially zero H₃PO₄ remains (notes/course-intro-metabolism-overview-2026-08-03.md §16).
NaOH for first equivalent = 0.100 mol
After this step, all 0.100 mol of phosphate exists as H₂PO₄⁻.
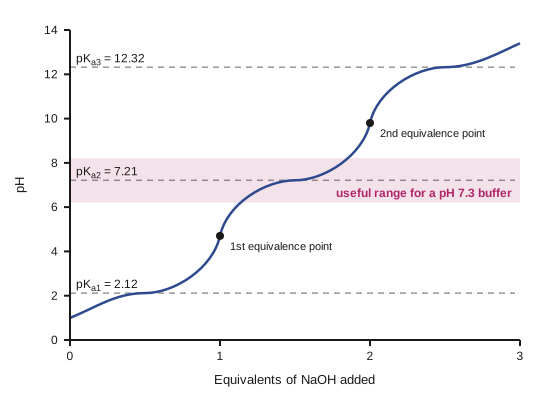
Step 3 — Speciate at pH 7.3 using pKa₂ to determine how much additional NaOH is needed.
Now use the Henderson-Hasselbalch equation with pKa₂ = 7.21, where [B] = [HPO₄²⁻] and [A] = [H₂PO₄⁻] (Key HW1 p.2):
pH = pKa₂ + log([HPO₄²⁻] / [H₂PO₄⁻]) 7.3 = 7.21 + log([HPO₄²⁻] / [H₂PO₄⁻]) log([HPO₄²⁻] / [H₂PO₄⁻]) = 7.3 - 7.21 = 0.09 [HPO₄²⁻] / [H₂PO₄⁻] = 10^0.09 = 1.23
Sanity check: pH 7.3 is just above pKa₂ = 7.21, so the base form (HPO₄²⁻) should slightly exceed the acid form (H₂PO₄⁻) -- and it does (ratio = 1.23, just above 1.0) (notes/course-intro-metabolism-overview-2026-08-03.md §14).
Distribute the 0.100 mol of phosphate between the two forms:
[HPO₄²⁻] + [H₂PO₄⁻] = 0.100 mol [HPO₄²⁻] = 1.23 x [H₂PO₄⁻] 1.23[H₂PO₄⁻] + [H₂PO₄⁻] = 0.100 2.23[H₂PO₄⁻] = 0.100 [H₂PO₄⁻] = 0.100 / 2.23 = 0.04484 mol [HPO₄²⁻] = 0.100 - 0.04484 = 0.05516 mol
Each mole of HPO₄²⁻ was produced by removing one proton from H₂PO₄⁻ with one mole of NaOH. Since we started step 3 with 0.100 mol of H₂PO₄⁻ and ended with 0.05516 mol as HPO₄²⁻, the additional NaOH needed is:
additional NaOH = 0.05516 mol
Step 4 — Calculate the total NaOH and its volume.
total NaOH = first equivalent + additional = 0.100 + 0.05516 = 0.15516 mol volume of 2.0 M NaOH = 0.15516 mol / 2.0 mol/L = 0.07758 L = 77.6 mL
(Key HW1 p.2)
Step 5 — Add water to reach 500 mL.
water = 500 mL - 100 mL (H₃PO₄) - 77.6 mL (NaOH) = 322.4 mL
(In practice, you would add water to a graduated volume mark of 500 mL.)
Final recipe (Key HW1 p.2):
100 mL of 1.0 M H₃PO₄ + 77.6 mL of 2.0 M NaOH + water to 500 mL = 200 mM phosphate buffer at pH 7.3
Part 2 — Deciding between Tris and phosphate for future LDH assays.
Phosphate is a common molecule inside cells -- it appears in DNA, RNA, ATP, and phospholipids -- so it can activate or inhibit enzymes that normally interact with phosphate-containing substrates (notes/course-intro-metabolism-overview-2026-08-03.md §17). To determine which buffer to use, the key provides a three-step experimental approach (Key HW1 p.2):
- Run LDH in each buffer at pH 7.3 and measure the initial velocity (v₀) (Key HW1 p.2).
- If both buffers give the same v₀, use either one -- neither is interfering with the enzyme (Key HW1 p.2).
- If one buffer gives a much faster v₀, then either that buffer is activating the enzyme or the other is inhibiting it. To distinguish, make a third buffer using a man-made compound such as HEPES and compare all three. Usually the man-made buffer is the safest choice (Key HW1 p.2).
The general principle is that man-made buffers (like Tris or HEPES) are preferred over biological buffers (like phosphate) because they are less likely to participate in the reaction under study (notes/course-intro-metabolism-overview-2026-08-03.md §17).
Common pitfalls
- Forgetting the first full equivalent of NaOH. The reagent is H₃PO₄, not H₂PO₄⁻. You must first fully convert H₃PO₄ to H₂PO₄⁻ (0.100 mol NaOH) before using Henderson-Hasselbalch with pKa₂. If you skip this step, you calculate only 0.05516 mol NaOH -- less than half of what is actually needed (notes/course-intro-metabolism-overview-2026-08-03.md §16).
- Using the wrong pKa. With three pKa values available, it is easy to grab the wrong one. At pH 7.3, the only relevant pKa is 7.21 (pKa₂). Using pKa₁ = 2.12 would give an absurd ratio, and using pKa₃ = 12.32 would as well.
- Forgetting that NaOH is 2.0 M, not 1.0 M. The volume of NaOH is total moles divided by 2.0, not 1.0. Using the wrong molarity doubles the volume and throws off the water calculation.
- Confusing the buffer-choice answer with a calculation. The second part of the question is experimental, not mathematical -- you have to run the enzyme and compare results.
Check yourself
Check yourself (original practice -- not from the course): Prepare 250 mL of 100 mM phosphate buffer at pH 6.8 from the same reagents (1.0 M H₃PO₄, 2.0 M NaOH, water).
Answer: Total phosphate = 0.100 mol/L x 0.250 L = 0.025 mol, so 25 mL of 1.0 M H₃PO₄. First equivalent of NaOH = 0.025 mol. At pH 6.8 with pKa₂ = 7.21: log([B]/[A]) = 6.8 - 7.21 = -0.41, so [B]/[A] = 10^(-0.41) = 0.389. Then [A] = 0.025/1.389 = 0.01800 mol, [B] = 0.025 - 0.01800 = 0.00700 mol. Additional NaOH = 0.00700 mol. Total NaOH = 0.025 + 0.00700 = 0.03200 mol. Volume of 2.0 M NaOH = 0.03200/2.0 = 0.01600 L = 16.0 mL. Water to 250 mL. Recipe: 25 mL H₃PO₄ + 16.0 mL NaOH + water to 250 mL.
Q3h — Why Enzyme Assays Need a Buffer
What the question asks
The question asks why a buffer is needed in an enzyme assay, even when H⁺ is not a substrate or product of the reaction (HW1 Q3h). In the LDH reaction discussed throughout Q3, H⁺ actually is a substrate, but many other enzyme assays do not consume or produce H⁺ directly. The question asks for all the reasons, not just one (HW1 Q3h).
What you need to know first
This module builds on the buffer concepts from Primer A. You also need the following question-specific concepts about protein structure and the bonds that hold it together:
Four levels of protein structure. Every enzyme is a protein, and its ability to function depends on maintaining the correct three-dimensional shape. Proteins have four levels of structure (notes/course-intro-metabolism-overview-2026-08-03.md §6):
Primary structure: The linear sequence of amino acids linked by covalent peptide bonds. This is the only level that is not sensitive to pH (covalent bonds do not break at normal pH changes).
Secondary structure: Local folding patterns -- alpha-helices and beta-sheets -- held together by hydrogen bonds between backbone atoms (the C=O of one amino acid and the N-H of another) (Key HW1 p.3).
Tertiary structure: The overall three-dimensional fold of a single polypeptide chain, stabilized by hydrogen bonds between amino acid side chains and by ionic bonds (salt bridges) between oppositely charged side chains (e.g., a positively charged lysine interacting with a negatively charged glutamate) (Key HW1 p.3). Hydrophobic packing of nonpolar side chains in the protein interior also contributes (notes/course-intro-metabolism-overview-2026-08-03.md §6).
Quaternary structure: The association of multiple polypeptide subunits into a complex (like LDH, which has four subunits), held together by the same types of bonds as tertiary structure -- hydrogen bonds and ionic bonds between subunits (Key HW1 p.3).
Why pH affects these bonds. Both hydrogen bonds and ionic bonds depend on the protonation state of amino acid side chains (Key HW1 p.3). When pH changes, side chains gain or lose protons, which alters their charge and their ability to form these bonds. For example, if a lysine side chain (normally +1 at pH 7) loses its proton at high pH, it can no longer form an ionic bond with a nearby glutamate (-1). Similarly, protonation changes alter hydrogen-bonding patterns (notes/course-intro-metabolism-overview-2026-08-03.md §6).
The active site relies on the same bonds. Substrates bind to the enzyme active site through hydrogen bonds and charge-charge (ionic) interactions between substrate functional groups and amino acid side chains lining the active site (Key HW1 p.3). These interactions are just as pH-sensitive as the structural bonds (notes/course-intro-metabolism-overview-2026-08-03.md §6).
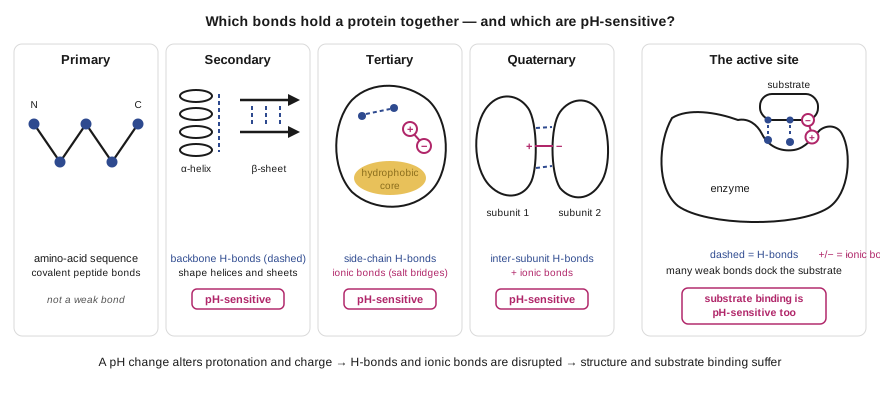
Step-by-step solution
The answer key gives three distinct, complementary reasons (Key HW1 p.3). Each one is sufficient on its own to require a buffer, and together they make the case overwhelming:
Reason 1 — Substrate binding to the active site is pH-sensitive.
Most substrates have functional groups that carry charges or form hydrogen bonds, and these interactions are necessary for the substrate to bind correctly in the active site (Key HW1 p.3). If pH changes, the protonation state of either the substrate or the active-site amino acid side chains changes, disrupting the binding interactions. Without proper binding, the enzyme cannot catalyze the reaction (Key HW1 p.3).
Reason 2 — Secondary structure depends on backbone hydrogen bonds, which are pH-sensitive.
Alpha-helices and beta-sheets are held together by hydrogen bonds between backbone C=O and N-H groups (Key HW1 p.3). Extreme pH changes can disrupt these hydrogen bonds, causing the secondary structure to unfold. Without the correct secondary structure, the enzyme loses its shape and its catalytic activity (Key HW1 p.3).
Reason 3 — Tertiary and quaternary structure depend on ionic bonds (salt bridges) and side-chain hydrogen bonds, both of which are pH-sensitive.
The three-dimensional fold (tertiary structure) and the association between subunits (quaternary structure) are maintained by hydrogen bonds between side chains and by ionic bonds between oppositely charged side chains (Key HW1 p.3). Changes in pH alter the charges on these side chains, breaking salt bridges and disrupting hydrogen bonds. The enzyme unfolds or its subunits dissociate, destroying catalytic activity (Key HW1 p.3).
Conclusion: Even when H⁺ is not directly involved as a substrate or product, changes in pH can destroy both the enzyme's ability to bind its substrate and the enzyme's structural integrity. A buffer keeps the pH constant to prevent these effects (Key HW1 p.3).
Common pitfalls
- Giving only one reason. The question explicitly asks for all reasons. The key provides three: substrate binding, secondary structure, and tertiary/quaternary structure (Key HW1 p.3).
- Being vague about bond types. Saying "pH affects enzyme structure" is too general. The answer must name the specific bond types: hydrogen bonds for secondary structure, and both hydrogen bonds and ionic bonds (salt bridges) for tertiary and quaternary structure (Key HW1 p.3).
- Confusing covalent bonds with weak bonds. Peptide bonds (covalent) are not broken by normal pH changes. It is the weak bonds -- hydrogen bonds and ionic bonds -- that are pH-sensitive.
- Thinking only about H⁺ as a reactant. The point of the question is that pH matters even when H⁺ is not in the reaction equation, because the enzyme itself and its substrate binding are pH-dependent.
Check yourself
Check yourself (original practice -- not from the course): An enzyme works optimally at pH 7.0 but loses all activity at pH 3.0, even though neither its substrate nor its product is H⁺. Using the three reasons above, explain what is happening at pH 3.0.
Answer: At pH 3.0, many amino acid side chains become protonated (e.g., glutamate gains a proton and loses its negative charge). (1) Substrate binding is disrupted because the charge-charge and hydrogen-bond interactions between the substrate and active-site residues are altered. (2) Backbone hydrogen bonds in alpha-helices and beta-sheets can be disrupted at extreme pH, unfolding secondary structure. (3) Ionic bonds (salt bridges) between oppositely charged side chains are destroyed because negatively charged residues become neutral, and hydrogen bonds between side chains are also disrupted. The enzyme's tertiary and quaternary structure collapses, and catalytic activity is lost.
Q3i — LDH Isozymes on Four Kinds of Gel
What the question asks
The question provides data about bovine lactate dehydrogenase (LDH) and asks you to predict what the banding patterns would look like on four different types of gel electrophoresis (HW1 Q3i). You are told the following (HW1 Q3i):
- Bovine LDH has a native molecular weight (MW) of 140,000 (HW1 Q3i).
- It is made of four equal-sized subunits, each with a MW of 35,000 (140,000 / 4 = 35,000) (HW1 Q3i).
- Each subunit is either an M subunit (M = muscle) or an H subunit (H = heart) (HW1 Q3i).
- The pI of the M subunit is 8.2; the pI of the H subunit is 6.0 (HW1 Q3i).
- The five possible isozymes (combinations of four subunits) are: M₄, M₃H, M₂H₂, MH₃, and H₄ (HW1 Q3i).
- The sample contains all five isozymes, and each gel is stained with Coomassie Blue after electrophoresis (HW1 Q3i).
- You must draw gels for: (a) IEF, (b) native PAGE, (c) SDS-PAGE, and (d) 2D IEF/SDS-PAGE, labeling each band with its name and MW and labeling the electrodes (HW1 Q3i).
What you need to know first
This module requires understanding four gel electrophoresis techniques. These are question-specific prerequisites, taught here:
What are isozymes? Isozymes (also called isoenzymes) are different forms of the same enzyme that catalyze the same reaction but have different subunit compositions, different charges, and therefore different physical properties (HW1 Q3i). LDH is a classic example: all five isozymes convert pyruvate + NADH + H⁺ to L-lactate + NAD⁺, but they are built from different ratios of M and H subunits (HW1 Q3i). The key fact for gel predictions is that all five isozymes have the same native MW (140,000) because they all contain exactly four subunits of 35,000 each -- the subunits just differ in which type (M or H) fills each position (HW1 Q3i).
What is pI (isoelectric point)? The pI is the pH at which a protein has zero net charge (notes/dna-microarrays-2d-gel-electrophoresis-2026-08-04.md §3). At pH values below its pI, a protein carries a net positive charge; at pH values above its pI, it carries a net negative charge. Since M has pI 8.2 and H has pI 6.0, the five tetramers have intermediate pI values: M₄ has the highest pI (closest to 8.2), H₄ has the lowest (closest to 6.0), and the mixed isozymes fall between them in proportion to their M:H ratio (HW1 Q3i).
Four gel types at a glance:
| Gel type | What it separates by | Protein structure preserved | How it works |
|---|---|---|---|
| IEF | pI (isoelectric point) | All levels (native) | Proteins migrate through a pH gradient until they reach the pH where their net charge is zero, then stop (notes/dna-microarrays-2d-gel-electrophoresis-2026-08-04.md §3) |
| Native PAGE | Charge-to-mass ratio and size | All levels (native) | Proteins migrate toward the anode (+) in an electric field; more negatively charged proteins move faster; all levels of structure remain intact (notes/dna-microarrays-2d-gel-electrophoresis-2026-08-04.md §4) |
| SDS-PAGE | Size (molecular weight) only | Only primary (denatured) | SDS denatures proteins and gives every protein the same charge-to-mass ratio; smaller proteins migrate faster (notes/dna-microarrays-2d-gel-electrophoresis-2026-08-04.md §5) |
| 2D IEF/SDS-PAGE | First dimension: pI; Second dimension: MW | IEF (native), then SDS (denatured) | Combines IEF (horizontal separation by pI) with SDS-PAGE (vertical separation by MW) to give a 2D map of spots (notes/dna-microarrays-2d-gel-electrophoresis-2026-08-04.md §17) |
Electrode orientation. In IEF, the cathode (-) is at the top (high pH / basic) and the anode (+) is at the bottom (low pH / acidic) (slides: Lecture 3 p.8). In native PAGE and SDS-PAGE, the cathode (-) is at the top and the anode (+) is at the bottom; proteins (which carry net negative charge at the running pH) migrate downward toward the anode (slides: Lecture 3 p.10; notes/dna-microarrays-2d-gel-electrophoresis-2026-08-04.md §21).
Step-by-step solution
(a) IEF gel — separation by isoelectric point
Reasoning: In IEF, each protein migrates through a pH gradient until it reaches the pH equal to its own pI, where its net charge becomes zero and it stops moving (notes/dna-microarrays-2d-gel-electrophoresis-2026-08-04.md §3). Since the five LDH isozymes have different subunit compositions, they have different overall pI values and will each stop at a different position in the gel. All five isozymes have the same native MW of 140,000, but IEF does not separate by size -- it separates only by pI (notes/dna-microarrays-2d-gel-electrophoresis-2026-08-04.md §3). This means we get five bands, each at 140,000 MW, spread vertically at five different pI positions.
Band positions: The pH gradient runs from basic at the top (cathode, -) to acidic at the bottom (anode, +) (slides: Lecture 3 p.8). M₄ has the highest pI (closest to 8.2) and focuses nearest the cathode (top). H₄ has the lowest pI (closest to 6.0) and focuses nearest the anode (bottom). The mixed isozymes fall in order between them (Key HW1 p.3):
Answer: Five bands, from top to bottom (Key HW1 p.3):
| Position (top to bottom) | Isozyme | MW | Approximate pI |
|---|---|---|---|
| 1 (nearest cathode, -) | M₄ | 140,000 | ~8.2 |
| 2 | M₃H | 140,000 | ~7.7 |
| 3 | M₂H₂ | 140,000 | ~7.1 |
| 4 | MH₃ | 140,000 | ~6.6 |
| 5 (nearest anode, +) | H₄ | 140,000 | ~6.0 |
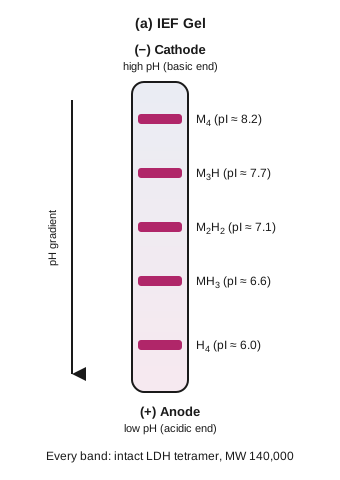
(b) Native PAGE gel — separation by charge and size
Reasoning: In native PAGE, all levels of protein structure remain intact, so the five isozymes stay as intact tetramers, each with MW 140,000 (notes/dna-microarrays-2d-gel-electrophoresis-2026-08-04.md §4). Since all five have the same size, size does not differentiate them -- only their charge-to-mass ratio matters for separation (notes/dna-microarrays-2d-gel-electrophoresis-2026-08-04.md §4).
The running buffer pH for native PAGE is approximately 8.3-8.6 (the resolving gel is at pH 8.8) (notes/dna-microarrays-2d-gel-electrophoresis-2026-08-04.md §4). At this pH:
- The H subunit (pI 6.0) is well above its pI, so it carries a large net negative charge (HW1 Q3i).
- The M subunit (pI 8.2) is very close to its pI at the running pH, so it carries only a small net negative charge (or near-zero charge) (HW1 Q3i).
More negative charge means faster migration toward the anode (+) at the bottom of the gel (notes/dna-microarrays-2d-gel-electrophoresis-2026-08-04.md §4). Therefore:
- H₄ (four H subunits, all highly negative) migrates the fastest (Key HW1 p.3).
- M₄ (four M subunits, all near-zero charge) migrates the slowest (Key HW1 p.3).
- The mixed isozymes migrate at intermediate speeds, proportional to their H:M ratio (Key HW1 p.3).
Answer: Five bands, from bottom to top (fastest to slowest) (Key HW1 p.3):
| Position (bottom to top) | Isozyme | MW | Relative speed |
|---|---|---|---|
| 1 (fastest, nearest anode) | H₄ | 140,000 | Fastest |
| 2 | MH₃ | 140,000 | Fast |
| 3 | M₂H₂ | 140,000 | Medium |
| 4 | M₃H | 140,000 | Slow |
| 5 (slowest, nearest cathode) | M₄ | 140,000 | Slowest |
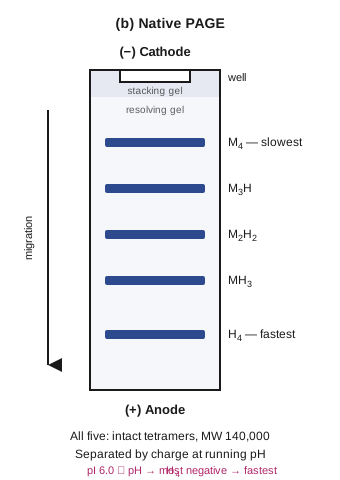
(c) SDS-PAGE gel — separation by molecular weight only
Reasoning: SDS is a strong detergent that completely denatures proteins, destroying secondary, tertiary, and quaternary structure (notes/dna-microarrays-2d-gel-electrophoresis-2026-08-04.md §5). Only primary structure (the amino acid sequence) remains intact. For LDH, this means every tetramer is broken into its individual subunits. SDS also coats every protein uniformly with negative charge, so all proteins end up with the same charge-to-mass ratio -- separation is by size alone (notes/dna-microarrays-2d-gel-electrophoresis-2026-08-04.md §5).
Here is the critical insight: the M subunit has MW 35,000 and the H subunit also has MW 35,000 (HW1 Q3i). SDS-PAGE cannot tell them apart because they are the same size. Every M and every H subunit from all five isozymes migrates to the same position.
The total count of subunits does not matter -- whether you loaded five different isozymes or just one, SDS-PAGE sees only individual 35,000 Da polypeptides, all co-migrating.
Answer: ONE band at MW 35,000 (Key HW1 p.3).
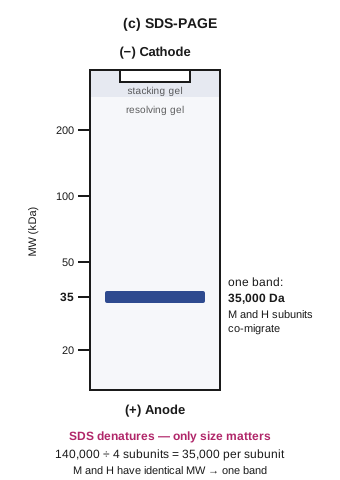
(d) 2D IEF/SDS-PAGE gel — separation by pI, then by MW
Reasoning: A 2D gel combines the two techniques in sequence (notes/dna-microarrays-2d-gel-electrophoresis-2026-08-04.md §17):
First dimension (IEF, horizontal): The five intact isozymes separate by pI, exactly as in part (a) -- five bands at different pI positions, all at 140,000 MW (notes/dna-microarrays-2d-gel-electrophoresis-2026-08-04.md §19).
SDS treatment: The IEF gel is soaked in SDS solution, which denatures all proteins into individual subunits (notes/dna-microarrays-2d-gel-electrophoresis-2026-08-04.md §20). Each tetramer (140,000) breaks into four subunits (35,000 each). The subunits remain at the horizontal position where their parent tetramer was focused.
Second dimension (SDS-PAGE, vertical): The SDS-soaked IEF gel is placed on top of an SDS-PAGE slab gel. When current is applied, the denatured subunits migrate downward according to their MW (notes/dna-microarrays-2d-gel-electrophoresis-2026-08-04.md §21). Since both M and H subunits are 35,000 Da, all subunits from every isozyme migrate to the same vertical level -- the 35,000 MW position.
The result is five spots, one beneath each IEF position from the first dimension, all at the 35,000 MW level. They form a horizontal line across the gel at the 35,000 level.
Answer: Five spots, all at MW 35,000, each positioned horizontally at the pI of its parent tetramer (Key HW1 p.3):
| Spot (left to right on gel) | Parent isozyme | pI position | MW position |
|---|---|---|---|
| 1 (most basic) | M₄ | ~8.2 | 35,000 |
| 2 | M₃H | ~7.7 | 35,000 |
| 3 | M₂H₂ | ~7.1 | 35,000 |
| 4 | MH₃ | ~6.6 | 35,000 |
| 5 (most acidic) | H₄ | ~6.0 | 35,000 |
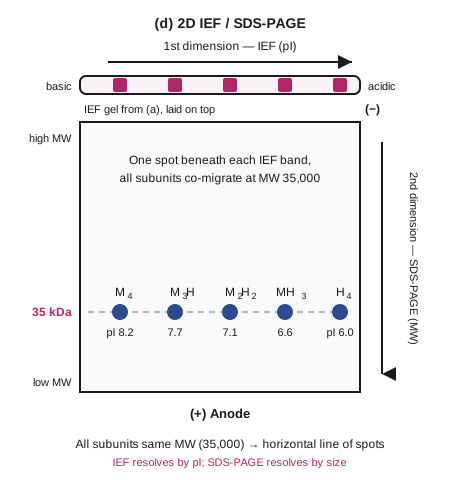
Common pitfalls
- Expecting multiple SDS-PAGE bands. The most common error is predicting two bands (one for M, one for H) or five bands on SDS-PAGE. Since M and H subunits have the same MW (35,000), SDS-PAGE produces exactly one band (Key HW1 p.3).
- Getting the electrode orientation wrong. In IEF, the cathode (-) is at the top (basic pH) and the anode (+) is at the bottom (acidic pH) (slides: Lecture 3 p.8). In native PAGE and SDS-PAGE, the anode (+) is also at the bottom because proteins coated with negative charge (or carrying net negative charge) must migrate downward toward the positive electrode (notes/dna-microarrays-2d-gel-electrophoresis-2026-08-04.md §21).
- Confusing IEF with native PAGE. In IEF, proteins stop at their pI (zero charge). In native PAGE, proteins do not stop -- they keep migrating at rates determined by their charge-to-mass ratio and size. Both produce five bands for LDH, but the mechanism of separation is different (notes/dna-microarrays-2d-gel-electrophoresis-2026-08-04.md §3, §4).
- Forgetting that native gels preserve quaternary structure. On IEF and native PAGE, LDH runs as intact 140,000 MW tetramers. Only SDS-PAGE and the second dimension of the 2D gel break them into 35,000 Da subunits (notes/dna-microarrays-2d-gel-electrophoresis-2026-08-04.md §5).
- Drawing 2D gel spots at 140,000 MW. The second dimension uses SDS-PAGE, which denatures proteins. The tetramers are broken into subunits. The spots appear at 35,000, not 140,000 (Key HW1 p.3).
Check yourself
Check yourself (original practice -- not from the course): Suppose the M subunit had MW 35,000 but the H subunit had MW 40,000 (instead of both being 35,000). How would the SDS-PAGE and 2D gel results change?
Answer: On SDS-PAGE, you would now see two bands instead of one: one at 35,000 (M subunits) and one at 40,000 (H subunits). On the 2D gel, each isozyme would no longer produce a single spot. M₄ would give one spot at 35,000. H₄ would give one spot at 40,000. M₃H would give two spots (one at 35,000, one at 40,000) beneath its IEF position. M₂H₂ would also give two spots. MH₃ would give two spots. The horizontal line would be replaced by two rows of spots: some at 35,000 and some at 40,000, depending on the subunit composition. M₄ and H₄ would each produce one spot; the three mixed isozymes would each produce two spots.
Part IV — Skill Drills
HW1 assigns problems from Biochemical Calculations (Segel) covering three quantitative skills: weak-acid/base calculations (problems #29, 38 (a, d, j), 40, and 41 on pages 92–93), Beer's Law calculations (example 5-4 on page 332 and problem #4 on page 352), and K′eq/ΔG calculations (examples 3-3, 3-4, and 3-5 on pages 161–164) (HW1 p.1). The Segel textbook pages are not available in this repository. This section first teaches the K′eq/ΔG°′ skill — the one quantitative skill not already covered in the primer — then provides original practice drills for all three skills with complete worked solutions.
K′eq and ΔG°′: The Skill, Taught
Every biochemical reaction has a thermodynamic quantity called free energy change (ΔG) — the energy available to a cell to do useful work such as movement, division, or biosynthesis (notes/course-intro-metabolism-overview-2026-08-03.md §7). The sign of ΔG determines whether a reaction can proceed on its own: a negative ΔG means the reaction proceeds forward spontaneously, a positive ΔG means the reaction requires an energy input to go forward, and a ΔG of zero means the system is at equilibrium and can do no work (notes/glycolysis-energetics-glycogen-2026-08-10.md §15). Cells cannot violate thermodynamics (notes/glycolysis-energetics-glycogen-2026-08-10.md §15). In this course, ΔG is measured in kcal/mol (notes/course-intro-metabolism-overview-2026-08-03.md §7).
The general reaction. Consider any reversible biochemical reaction with substrates (S) and products (P) (slides: Lecture 7 p.2):
S₁ + S₂ ⇌ P₁ + P₂
At any instant, the actual concentrations of products and substrates define the mass-action ratio Q (notes/glycolysis-energetics-glycogen-2026-08-10.md §15):
Q = [P₁][P₂] / [S₁][S₂]
For a simple one-substrate, one-product reaction, this simplifies to Q = [P]/[S].
The equilibrium constant (K′eq). When a reaction reaches equilibrium — when forward and reverse rates are equal and no net change occurs — the product-to-substrate ratio settles at a fixed value called the equilibrium constant (notes/glycolysis-energetics-glycogen-2026-08-10.md §15). The prime mark (′) indicates the constant is measured at pH 7, where the proton concentration is held at 10⁻⁷ M rather than 1 M (notes/glycolysis-energetics-glycogen-2026-08-10.md §15). At 1 M proton concentration (pH 0) the enzyme would not function, so biochemists use the pH 7 convention (notes/glycolysis-energetics-glycogen-2026-08-10.md §4).
Living cells never actually let reactions reach equilibrium — they operate in a steady state, with substrates continually flowing in and products flowing out (notes/glycolysis-energetics-glycogen-2026-08-10.md §15). But equilibrium math provides a powerful reference point for comparing reactions and predicting direction.
Standard free energy change (ΔG°′). This is the free energy change when all species are at 1 M concentration and pH is 7 (notes/glycolysis-energetics-glycogen-2026-08-10.md §4). When every species is at 1 M, the mass-action ratio Q = 1, and ln(1) = 0, which eliminates one term from the math — this is why 1 M was chosen as the standard reference state (notes/glycolysis-energetics-glycogen-2026-08-10.md §15).
The master equation. The actual free energy change under any set of concentrations is (notes/glycolysis-energetics-glycogen-2026-08-10.md §15):
ΔG = ΔG°′ + RT·ln Q
where:
- R = the gas constant = 1.987 cal·mol⁻¹·K⁻¹
- T = absolute temperature in kelvin (25°C = 298 K)
- ln = natural logarithm (logarithm base e)
- Q = [products]/[substrates] at the actual concentrations in the cell
In words: the actual free energy change (ΔG) equals the reference value under standard conditions (ΔG°′) adjusted by how far the current concentrations are from equilibrium (the RT·ln Q term) (notes/glycolysis-energetics-glycogen-2026-08-10.md §15). The real ΔG in a living cell depends on the actual concentrations, which change throughout the day (notes/glycolysis-energetics-glycogen-2026-08-10.md §15).
Deriving ΔG°′ from K′eq. At equilibrium, two things are true: ΔG = 0 (the reaction can do no work) and Q = K′eq (the concentrations have settled at their equilibrium values) (notes/glycolysis-energetics-glycogen-2026-08-10.md §15). Substituting both into the master equation:
0 = ΔG°′ + RT·ln K′eq
Rearranging:
ΔG°′ = −RT·ln K′eq
This equation connects the equilibrium constant — an experimentally measurable quantity — to the standard free energy change. A large K′eq (products heavily favored at equilibrium) gives a large negative ΔG°′. A small K′eq (substrates favored at equilibrium) gives a positive ΔG°′ (notes/glycolysis-energetics-glycogen-2026-08-10.md §15).
ΔG°′ values are reference numbers used for comparing reactions in tables — for example, the values given for 1,3-BPG hydrolysis (approximately −12 kcal/mol) and PEP hydrolysis (approximately −13.8 kcal/mol) in glycolysis are ΔG°′ values under standard conditions (notes/glycolysis-energetics-glycogen-2026-08-10.md §15).
Reaction-direction logic. The sign of ΔG tells you whether a reaction proceeds forward or in reverse under current conditions. The relationship between Q and K′eq determines the sign (notes/glycolysis-energetics-glycogen-2026-08-10.md §15):
- When Q < K′eq: the system has not yet reached equilibrium, ln(Q) < ln(K′eq), and ΔG < 0 — the reaction proceeds forward spontaneously.
- When Q > K′eq: the system has overshot equilibrium, ln(Q) > ln(K′eq), and ΔG > 0 — the reaction proceeds in the reverse direction (or requires energy to go forward).
- When Q = K′eq: the system is at equilibrium, ΔG = 0 — no net reaction occurs.
This is why a reaction with a positive ΔG°′ (unfavorable under standard 1 M conditions) can still proceed forward in a cell: if the actual product-to-substrate ratio is low enough (Q much less than K′eq), the RT·ln Q term drives ΔG negative.
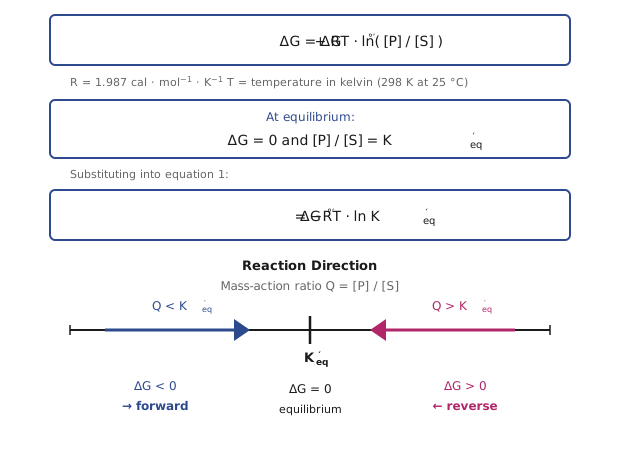
Two additional relationships (notes/glycolysis-energetics-glycogen-2026-08-10.md §16):
- Reversing a reaction reverses the sign of ΔG and inverts the equilibrium constant. If the forward reaction has ΔG°′ = −5 kcal/mol, the reverse reaction has ΔG°′ = +5 kcal/mol.
- Coupling (adding) two reactions: their ΔG values are added, but their K′eq values are multiplied. This is how cells drive thermodynamically unfavorable reactions by coupling them to favorable ones — for example, coupling an endergonic biosynthetic reaction with the exergonic hydrolysis of ATP (notes/glycolysis-energetics-glycogen-2026-08-10.md §16).
Lecture-note cross-references: notes/glycolysis-energetics-glycogen-2026-08-10.md §4, §15, §16.
Henderson–Hasselbalch Drills
HW1 assigns Segel weak-acid/base problems #29, 38 (a, d, j), 40, and 41 on pages 92–93 (HW1 p.1). The Segel textbook is not available in this repository. The following original drills exercise the same Henderson–Hasselbalch skills taught in Primer A.
Drill 1 (original practice — not from the course): A solution is prepared by mixing 0.15 M acetic acid with 0.25 M sodium acetate. The pKa of acetic acid is 4.76. What is the pH of the solution?
Solution:
Acetic acid (CH₃COOH) is the acid form (A); acetate (CH₃COO⁻) is the conjugate base form (B). Apply the Henderson–Hasselbalch equation (see Primer A):
pH = pKa + log([B] / [A])
Substitute the known values:
pH = 4.76 + log(0.25 / 0.15)
pH = 4.76 + log(1.667)
pH = 4.76 + 0.22
Answer: pH = 4.98
The pH is above the pKa because there is more base form than acid form in solution.
Drill 2 (original practice — not from the course): You have 100 mL of 200 mM phosphate buffer at pH 7.0. The pKa₂ of phosphoric acid is 7.21. You add 5.0 mL of 1.0 M HCl. What is the new pH? (Henderson–Hasselbalch uses a ratio of [B] to [A], so the small volume change does not affect the calculation.)
Solution:
At pH 7.0, the relevant phosphate equilibrium is H₂PO₄⁻ (acid form, A) ⇌ HPO₄²⁻ (base form, B). See Primer A for the Henderson–Hasselbalch equation and for how adding strong acid converts B into A.
Step 1 — Find the initial amounts of B and A.
Total phosphate = 200 mM x 100 mL = 20 mmol.
7.0 = 7.21 + log([B] / [A])
log([B] / [A]) = −0.21
[B] / [A] = 10⁻⁰·²¹ = 0.617
With [B] + [A] = 20 mmol and [B] = 0.617 x [A]:
1.617 x [A] = 20 mmol
[A] = 12.37 mmol ; [B] = 7.63 mmol
Step 2 — Add the HCl.
5.0 mL x 1.0 M = 5.0 mmol of H⁺. Each proton converts one HPO₄²⁻ (B) into one H₂PO₄⁻ (A):
new [B] = 7.63 − 5.0 = 2.63 mmol
new [A] = 12.37 + 5.0 = 17.37 mmol
Step 3 — Apply Henderson–Hasselbalch again.
pH = 7.21 + log(2.63 / 17.37)
pH = 7.21 + log(0.1514)
pH = 7.21 + (−0.82)
Answer: pH = 6.39
The pH dropped by 0.61 units. The buffer prevented a much larger drop (5 mmol of HCl in 105 mL of water alone would give pH below 2), but the added acid consumed most of the available base form (5.0 of the original 7.63 mmol), significantly shifting the ratio.
Beer's Law Drills
HW1 assigns Segel Beer's Law problems: example 5-4 on page 332 and problem #4 on page 352 (HW1 p.1). The Segel textbook is not available in this repository. The following original drills exercise the same Beer's Law skills taught in Primer B.
Drill 1 (original practice — not from the course): A compound dissolved in buffer gives an absorbance of A₄₅₀ = 0.85 in a standard 1 cm cuvette. The molar extinction coefficient at 450 nm is ε = 18,000 M⁻¹cm⁻¹. What is the concentration?
Solution:
Apply Beer's Law (see Primer B):
A = ε x l x c
Solve for c:
c = A / (ε x l)
c = 0.85 / (18,000 M⁻¹cm⁻¹ x 1 cm)
c = 4.72 x 10⁻⁵ M
Answer: c = 47.2 µM (4.72 x 10⁻⁵ M)
Drill 2 (original practice — not from the course): A protein solution is too concentrated to measure directly, so you dilute it 1:5 (one part sample plus four parts buffer). The diluted sample gives A₂₈₀ = 0.62 in a 1 cm cuvette. The molar extinction coefficient at 280 nm is ε = 25,000 M⁻¹cm⁻¹. What is the concentration of the original, undiluted solution?
Solution:
Step 1 — Find the concentration of the diluted sample using Beer's Law (see Primer B).
c_diluted = A / (ε x l)
c_diluted = 0.62 / (25,000 M⁻¹cm⁻¹ x 1 cm)
c_diluted = 2.48 x 10⁻⁵ M = 24.8 µM
Step 2 — Correct for the dilution. A 1:5 dilution means the sample was diluted to one-fifth of its original concentration. To find the original concentration, multiply by the dilution factor:
c_original = 5 x c_diluted
c_original = 5 x 24.8 µM
Answer: c_original = 124 µM (1.24 x 10⁻⁴ M)
K′eq and ΔG°′ Drills
HW1 assigns Segel K′eq and ΔG problems: examples 3-3, 3-4, and 3-5 on pages 161–164 (HW1 p.1). The Segel textbook is not available in this repository. The following original drills exercise the same K′eq/ΔG°′ skills taught in K′eq and ΔG°′: The Skill, Taught.
Drill 1 (original practice — not from the course): A reaction has K′eq = 100 at 25°C. Calculate ΔG°′. Use R = 1.987 cal·mol⁻¹·K⁻¹.
Solution:
Apply the relationship derived in The Skill, Taught:
ΔG°′ = −RT·ln K′eq
Convert temperature to kelvin: T = 25 + 273 = 298 K.
ΔG°′ = −(1.987 cal·mol⁻¹·K⁻¹)(298 K) x ln(100)
ΔG°′ = −(592.1 cal·mol⁻¹) x 4.605
ΔG°′ = −2,727 cal/mol
Answer: ΔG°′ = −2.73 kcal/mol
A K′eq of 100 means products are heavily favored at equilibrium (100 times more product than substrate). The corresponding ΔG°′ is negative, confirming that the reaction releases free energy under standard conditions.
Drill 2 (original practice — not from the course): A reaction has ΔG°′ = +3.0 kcal/mol, which means it is thermodynamically unfavorable under standard 1 M conditions. However, inside a cell the actual concentrations give a mass-action ratio of [P]/[S] = 0.001. At 25°C, is the reaction spontaneous in the forward direction? Use R = 1.987 cal·mol⁻¹·K⁻¹.
Solution:
Apply the master equation from The Skill, Taught:
ΔG = ΔG°′ + RT·ln([P]/[S])
Convert ΔG°′ to cal/mol for unit consistency: +3.0 kcal/mol = +3,000 cal/mol.
ΔG = +3,000 cal/mol + (1.987 cal·mol⁻¹·K⁻¹ x 298 K) x ln(0.001)
ΔG = +3,000 + (592.1) x (−6.908)
ΔG = +3,000 + (−4,090)
ΔG = −1,090 cal/mol
Answer: ΔG = −1.09 kcal/mol — yes, the reaction is spontaneous in the forward direction.
Even though ΔG°′ is positive (unfavorable at standard 1 M concentrations), the very low product-to-substrate ratio (Q = 0.001, far below K′eq) makes the RT·ln Q term sufficiently negative to overcome the positive ΔG°′. This demonstrates why ΔG°′ alone does not tell you whether a reaction proceeds in a living cell — the actual concentrations matter.
Source Provenance
Source provenance and build notes
Exact inputs (SHA-256):
dc27d3cd0cc4f60a89102ed6207840a96d2c893efa6470e700b94b37175a1f97  homeworks/HW 1 Summer 2026.pdf
da7aded24946885337360044ed7c54491089721d82fbb06cbe8750975dc463cd  homeworks/Key HW 1 Summer 2026.pdf
128fae94ef8de1d06762db8f1a70784972e025c00e2620239c60911745c082e0  notes/course-intro-metabolism-overview-2026-08-03.md
589f8a59575e0df0ff9b213a4b1dcbb60bc385662885b54297a9ddd57a93329e  notes/dna-microarrays-2d-gel-electrophoresis-2026-08-04.md
d4b16947ffbd1d8fe880e347cf7d3eeecbcc3cf89e3847da40723f7b379a5f68  notes/microcalorimetry-and-glycolysis-intro-2026-08-05.md
b74454dfcb366c847ac8d6fe0e5f507caa72c88c54ca7903356aa3a1e23fddc6  notes/glycolysis-energetics-glycogen-2026-08-10.md
9c33cd94647141a3e3b3bb98c4ebf025c723413a57e3629a348dec4aac502e3d  slides/Lecture 2 BIS 103 (key concepts from BIS 102).pdf
042cba34ac5ee859ee1e54c88069221c798f49ab717be9fa5f61d5e033463a40  slides/Lecture 3 BIS 103 (DNA microarrays 2D IEF SDS-PAGE).pdf
27f0aaf9fd706e423970bd257409c72977705ee10cbc91087cfdabef14f11844  slides/Lecture 4 BIS 103 (Microcalorimetry).pdf
48f83728177ac849037327510d490dd5c49357f1473e14dbb9e0516876956ed7  slides/Lecture 5 (Key Concepts in Metabolism; glycolysis).pdf
31b78aa49e013723a662e6bbd93afece2d1d17a609bfa996392d273d77a88893  slides/Lecture 6 (glycolysis cont.).pdf
6eca1d491842700a70e038935e2efc01f04a6991f7356d75a46404897e383f83  slides/Lecture 7 (delta G, delta Keg, and Beer's Law).pdf
All 26 figures are original slide-derived redrawings (no copied or traced artwork); each SVG carries its derivation credit in its caption and in the Figure Index.
Generated 2026-08-19 under the hw-tutor contract (.claude/agents/hw-tutor.md) by an orchestrated multi-agent workflow; assembled and completed by the orchestrator after an early stop requested by the user.